
One of my crusades the past few years has been against the misuse of a couple of the newfangled metrics. Both average exit velocity and average spin rate are misleading, since they encompass contributions from multiple components. Yet many, including yours truly, use the aggregate metric to support an argument which may be untrue since one of the components tells a different story.
More also doesn't always mean better. For instance, spin rate affects pitches differently. For this example, I'm ignoring that not all spin is useful, as that's a topic for another day. In simplified form, spin aids side to side movement while pitches designed to drop don't need spin since gravity is doing the work. Someone like Hyun-Jin Ryu doesn't show up high when sorting by average spin rate, since spin isn't desired for most changeups. That said, backspin on a four-seam fastball counteracts gravity, fooling the hitter with its perceived rising action.
One of the assumptions made with batters is exit velocity helps batting average. Statcast average exit velocity (AEV) is used to judge if a BABIP is due for regression, good or bad.
Yet, there are a plethora of hitters with below average AEV but high xBA (expected batting average). Sure, some is due to better contact rates, but there still appears to be a disconnect. How can he continue to hit for average with such a low AEV?
Before going further, keep in mind Statcast xBA compares the specifications of every batted ball (EV, launch
One of my crusades the past few years has been against the misuse of a couple of the newfangled metrics. Both average exit velocity and average spin rate are misleading, since they encompass contributions from multiple components. Yet many, including yours truly, use the aggregate metric to support an argument which may be untrue since one of the components tells a different story.
More also doesn't always mean better. For instance, spin rate affects pitches differently. For this example, I'm ignoring that not all spin is useful, as that's a topic for another day. In simplified form, spin aids side to side movement while pitches designed to drop don't need spin since gravity is doing the work. Someone like Hyun-Jin Ryu doesn't show up high when sorting by average spin rate, since spin isn't desired for most changeups. That said, backspin on a four-seam fastball counteracts gravity, fooling the hitter with its perceived rising action.
One of the assumptions made with batters is exit velocity helps batting average. Statcast average exit velocity (AEV) is used to judge if a BABIP is due for regression, good or bad.
Yet, there are a plethora of hitters with below average AEV but high xBA (expected batting average). Sure, some is due to better contact rates, but there still appears to be a disconnect. How can he continue to hit for average with such a low AEV?
Before going further, keep in mind Statcast xBA compares the specifications of every batted ball (EV, launch angle, etc.) to all other balls hit in a like manner, then classifies that batted ball according to the archived data. If a certain ball resulted in a hit 40 percent of the time, .4 hits are incorporated into the player's xBA.
Thinking about how Statcast derives their xSTATS and the apparent disconnect between AEV and batting average gave me an idea. Perhaps the same way more spin isn't always beneficial, perhaps more exit velocity doesn't always aid batting average.
I'm sure others have undertaken this study, likely in far greater detail. My method involves correlation, looking at how AEV on grounders, fly balls and outfield line drives relate to their respective BABIP. Line drives to infielders were omitted, since the likelihood of a hit is almost always a product of where it was hit and not how hard.
By means of review, correlation is measured on a scale of -1 to 1. A perfectly random relationship has no correlation (0). A perfectly direct correlation is 1, while a perfectly indirect correlation is -1. For example, the series 1, 2, 3, 4 is a perfect direct correlation with 10, 20, 30, 40, whereas 4, 3, 2, 1 is a perfect indirect correlation to 10, 20, 30, 40.
To avoid sample size noise, 2018 and 2019 were used in the study. A minimum of 50 batted ball events per component were needed for inclusion. The correlations were computed via Excel:
| BABIP | 2019 | 2018 |
|---|---|---|
| Groundball | 0.28 | 0.26 |
| Outfield Line Drive | 0.24 | 0.30 |
| Flyball | -0.13 | -0.11 |
Granted, none of these correlations are strong, but harder hit grounders and outfield line drives aid BABIP. Meanwhile, flyball BABIP benefits from lower exit velocity. In retrospect, this all makes sense, especially as shallower flyballs fall in more often than those landing behind outfielders or hitting the wall/fence.
Again, this is a crude study, so conclusions need to be drawn in that vein, but this explains why many batters will generate seemingly ugly Statcast levers but sustain an elevated batting average. For example, the overall AEV may be low, but the player's groundball AEV may be above average while their flyball AEV is below average. This is indicative of a flatter swing, as not everyone is a launch angle disciple.
While it's easy to understand why a softly hit fly ball can land safely, it's impossible to imagine many softly hit fly balls leaving the yard. Here is the correlation between AEV of flyballs and HR%.
| HR% | 2019 | 2018 |
|---|---|---|
| FB | 0.83 | 0.81 |
| OLD | 0.51 | 0.48 |
Sure enough, there is a strong relationship with flyballs. The outfield line drive is still positive, though lower line drives, not high enough to clear the fences, drag the correlation down.
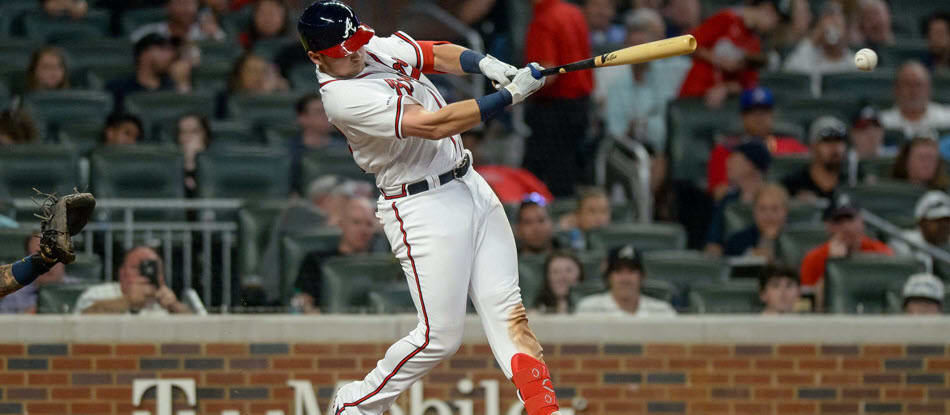
A great case study for component analysis is Atlanta Braves third baseman Austin Riley. There is a stark contrast between his component batted ball data, reflective of a change in approach.
AEV | 2019 | 2020 |
|---|---|---|
| Overall | 89.4 | 91 |
| Groundball | 83.3 | 88.4 |
| Outfield Line Drive | 94.6 | 96.6 |
| Flyball | 95.7 | 92 |
Last season, Riley's overall AEV was 1.6 mph ahead of his rookie season's mark. The catch is his flyball AEV dipped while it increased on grounders and outfield line drives.
Taking a step back to review some physics, maximum momentum is transferred if the trajectory of the ball and path of the swing are on the same plane. This is what drives the uppercut revolution, as a thrown baseball's trajectory is always down. The greater the momentum, the higher the velocity.
In 2019, Riley hit fly balls with more authority, suggesting he flattened his swing last year. A flatter swing transfers more momentum when topping the ball, hence the increase in groundball AEV.
Component analysis is just the beginning when evaluating Riley for 2021. Further evidence he changed his swing path is his batted ball distribution over the first two years of his career.
| LD% | GB% | FB% | |
|---|---|---|---|
2019 | 25.0% | 26.2% | 48.8% |
2020 | 23.7% | 41.7% | 34.5% |
Note the huge spike in grounders and associated drop of flyballs. As expected, a flatter swing generated more grounders. Now here is Riley's plate skills data.
| O-Swing% | Z-Swing% | O-Contact% | Z-Contact% | Contact% | |
|---|---|---|---|---|---|
| 2019 | 34.7% | 80.4% | 42.6% | 73.5% | 63.4% |
| 2020 | 30.2% | 76.7% | 46.2% | 82.3% | 72.4% |
Not only did he alter his swing, but Riley also was more selective in and out of the zone, improving his contact nine points.
The following is speculation, but Riley may have opted to sacrifice power for more contact by altering his approach and swing mechanics. What actually happened?
| BA | OBP | SLG | wOBA | |
|---|---|---|---|---|
| 2019 | 0.226 | 0.279 | 0.471 | 0.307 |
| 2020 | 0.239 | 0.301 | 0.415 | 0.307 |
Outcomes in small samples are noisy, but Riley's power did drop precipitously. His wOBA was the same, but from a fantasy baseball point of view, I want 2019's slash since it should result in higher counting stats.
It's an oversimplification to state Riley's power potential has taken a hit; he's still a work in progress. However, automatically assuming he rebounds in the department is also faulty logic, since he was a different hitter last season and may not revert to his old ways.
Ideally, he melds the two, learning when to cut loose and when to put the ball in play. In fact, while Riley's Barrel% dropped last season, it was still a hefty 64th percentile. Barrels portend power, so he's already shown the ability to turn on a pitch. The next step in his development could be maintaining the more patient approach but learning when to swing for the fences.
Tying this all back to component AEV, much of this analysis is possible without parsing out AEV. However, doing so adds another layer to the evaluation, clarifying why things happened, which in turn facilitates setting future expectations.