

I've been on this soapbox for years, but there are still some refusing to believe me. Simply put, in rotisserie scoring, it is easier to gain/lose points in the ratio categories.
Here is why. In general, batting average, ERA and WHIP are more tightly bunched than the counting categories. Furthermore, ratios can worsen, so you can gain ground via the teams ahead of you suffering a bad day and dropping below you.
The best way to illustrate the proximity of ratio categories is using normalized standings. Below is a table showing the average standings for 15-team leagues. The NFBC Main Event was used for this purpose, since there are multiple leagues played under the same rules. The idea is the total for each category is the same. I used 1000, so if you add up the totals for the 15 teams, the sum for each category is 1000.
| Points | HR | RBI | R | SB | AVG | W | K | SV | ERA | WHIP |
|---|---|---|---|---|---|---|---|---|---|---|
| 15 | 78.6 | 75 | 74.7 | 91.1 | 69.8 | 81.6 | 77.1 | 107.2 | 76.4 | 72.1 |
| 14 | 75.5 | 73.2 | 72.4 | 84.3 | 68.9 | 77.7 | 74.4 | 97 | 73.4 | 70.5 |
| 13 | 73.5 | 71.7 | 71.3 | 80.3 | 68.4 | 75.5 | 72.8 | 90.8 | 71.4 | 69.5 |
| 12 | 71.9 | 70.5 | 70.2 | 77 | 68 | 73.2 | 71.6 | 85.9 | 70.1 | 68.8 |
| 11 | 70.5 | 69.5 | 69.4 | 73.9 | 67.6 | 71.8 | 70.2 | 81.4 | 69.1 | 68.1 |
| 10 | 69.3 | 68.5 | 68.5 | 70.9 | 67.2 | 70.1 | 69.2 | 77.8 | 68 | 67.4 |
| 9 | 68.2 | 67.6 | 67.7 | 68.4 | 66.9 | 68.6 | 68.2 | 73.7 | 67 | 67 |
| 8 | 66.9 | 66.7 | 66.9 | 65.8 | 66.6 | 67.1 | 67 | 68.7 | 66.3 | 66.5 |
| 7 | 65.5 | 65.9 |
I've been on this soapbox for years, but there are still some refusing to believe me. Simply put, in rotisserie scoring, it is easier to gain/lose points in the ratio categories.
Here is why. In general, batting average, ERA and WHIP are more tightly bunched than the counting categories. Furthermore, ratios can worsen, so you can gain ground via the teams ahead of you suffering a bad day and dropping below you.
The best way to illustrate the proximity of ratio categories is using normalized standings. Below is a table showing the average standings for 15-team leagues. The NFBC Main Event was used for this purpose, since there are multiple leagues played under the same rules. The idea is the total for each category is the same. I used 1000, so if you add up the totals for the 15 teams, the sum for each category is 1000.
| Points | HR | RBI | R | SB | AVG | W | K | SV | ERA | WHIP |
|---|---|---|---|---|---|---|---|---|---|---|
| 15 | 78.6 | 75 | 74.7 | 91.1 | 69.8 | 81.6 | 77.1 | 107.2 | 76.4 | 72.1 |
| 14 | 75.5 | 73.2 | 72.4 | 84.3 | 68.9 | 77.7 | 74.4 | 97 | 73.4 | 70.5 |
| 13 | 73.5 | 71.7 | 71.3 | 80.3 | 68.4 | 75.5 | 72.8 | 90.8 | 71.4 | 69.5 |
| 12 | 71.9 | 70.5 | 70.2 | 77 | 68 | 73.2 | 71.6 | 85.9 | 70.1 | 68.8 |
| 11 | 70.5 | 69.5 | 69.4 | 73.9 | 67.6 | 71.8 | 70.2 | 81.4 | 69.1 | 68.1 |
| 10 | 69.3 | 68.5 | 68.5 | 70.9 | 67.2 | 70.1 | 69.2 | 77.8 | 68 | 67.4 |
| 9 | 68.2 | 67.6 | 67.7 | 68.4 | 66.9 | 68.6 | 68.2 | 73.7 | 67 | 67 |
| 8 | 66.9 | 66.7 | 66.9 | 65.8 | 66.6 | 67.1 | 67 | 68.7 | 66.3 | 66.5 |
| 7 | 65.5 | 65.9 | 66.1 | 63.6 | 66.4 | 65.4 | 65.8 | 64.3 | 65.6 | 66 |
| 6 | 64.3 | 65 | 65.2 | 61.3 | 66.1 | 63.8 | 64.8 | 60.4 | 64.8 | 65.6 |
| 5 | 63 | 64.1 | 64.3 | 59.1 | 65.8 | 62 | 63.6 | 54.7 | 64 | 65.1 |
| 4 | 61.4 | 63.1 | 63.3 | 56.3 | 65.4 | 60.2 | 62.3 | 48.3 | 63 | 64.5 |
| 3 | 59.9 | 61.8 | 62.1 | 53.5 | 65 | 57.7 | 60.6 | 40.8 | 61.9 | 63.9 |
| 2 | 57.6 | 60.1 | 60.6 | 50.5 | 64.3 | 55.2 | 58.2 | 31.7 | 60.6 | 63.1 |
| 1 | 54 | 57.3 | 57.3 | 44 | 63.4 | 50.3 | 54.3 | 17.2 | 58.6 | 61.7 |
The top to bottom deltas are as follows:
| HR | RBI | R | SB | AVG | W | K | SV | ERA | WHIP |
|---|---|---|---|---|---|---|---|---|---|
| 24.6 | 17.7 | 17.4 | 47.1 | 6.4 | 31.3 | 22.8 | 90 | 17.8 | 10.4 |
The method isn't perfect since the at-bats and innings pitched are different for each team, but it's not enough to detract from the big picture. Batting average is the most tightly clustered category, followed by WHIP. ERA is in the same neighborhood as RBI and runs.
Practically speaking, the difference between adjacent teams widens at either end, so viewing the first to last difference is misleading. Let's check it out from 4th to 12th place:
| HR | RBI | R | SB | AVG | W | K | SV | ERA | WHIP |
|---|---|---|---|---|---|---|---|---|---|
| 10.5 | 7.4 | 6.9 | 20.7 | 2.6 | 13 | 9.3 | 37.6 | 7.1 | 4.3 |
In order to compare, let's divide by the number of standings places in each set (14 for first to last, eight for 4th to 12th).
| Points | HR | RBI | R | SB | AVG | W | K | SV | ERA | WHIP |
|---|---|---|---|---|---|---|---|---|---|---|
| 1st - 15th | 1.76 | 1.26 | 1.24 | 3.36 | 0.46 | 2.24 | 1.63 | 6.43 | 1.27 | 0.74 |
| 4th - 12th | 1.31 | 0.93 | 0.86 | 2.59 | 0.32 | 1.63 | 1.16 | 4.70 | 0.89 | 0.54 |
The trends between categories are the same, but according to the average standings, it's easier to gain or lose if you're in the middle as opposed to either end.
Of course, it ultimately depends on where you're situated in your specific leagues. Average standings are nice for getting a general idea, but the distribution within each league is unique.
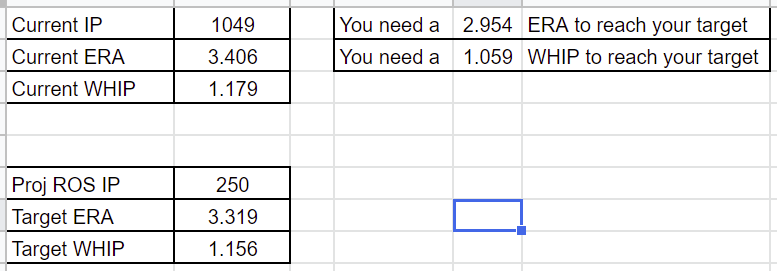
To that end, I have put together a simple tool to calculate what's needed to achieve a target ERA and WHIP. All you need is your fantasy team's season-to-date innings, ERA and WHIP. You estimate the number of innings you'll compile for the rest of the season along with providing your target ERA and WHIP. The tool reveals the ratios necessary to meet your goals.
I don't expect to crash the Internet, but in case multiple fantasy managers want to use the tool at the same time, there are five calculators so please try to pick one no one else is using.
It's straightforward. Just fill in the cells in Column B and your targets appear in Column E.
Here are some screenshots how I used it in my RotoWire Online Championship league.
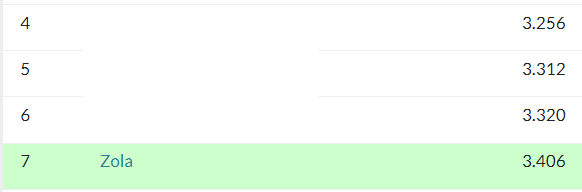
ERA
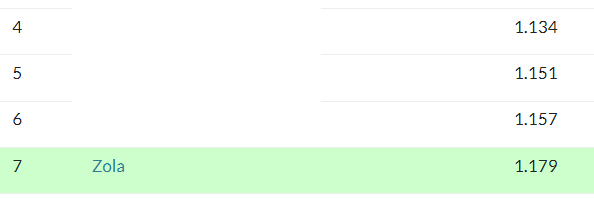
WHIP
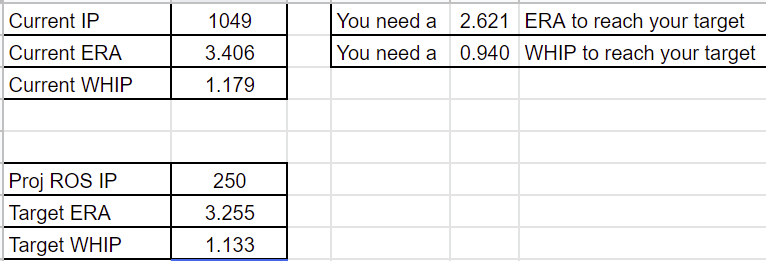
I have 1049 innings so far. We're just past the three-quarter mark, so let's say I'll collect another 250 innings.
I'm curious what it takes to gain three points in each, so my target ERA is 3.255 and WHIP is 1.133.
This is clearly not happening, so let's be less greedy and shoot for two points.
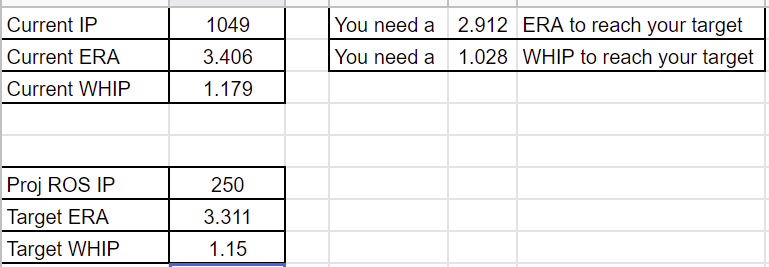
Blech, this isn't all that encouraging either, but at least it's within the realm of possibilities, especially if the teams above me have a rough finish to the season. How about gaining just one point?
I'll be honest, it doesn't bode well for me. Unless my team goes nuts, and I stream perfectly, I need help from the teams above me to gain in ratios. Argh.
You may be thinking my general concept is faulty and everyone should stick to counting stats when trying to make up ground. Hopefully you'll find it refreshing I didn't cherry-pick a scenario to corroborate my agenda. The bottom line is your team's place in the category dictates its ability to make up ground, regardless of the stat.
Here's a nice example of a team needing to make a decision with regards to pitching. This is a 15-team NFBC Satellite League I co-manage with Derek VanRiper. Humblebrag alert, we've been trading first and second place for the last few weeks with Dan Kenyon, aka Doughboys, one of the ambassadors of the NFBC. On our respective tail is some guy named Lindy Hinkleman. Here is where we sit in the pitching categories.
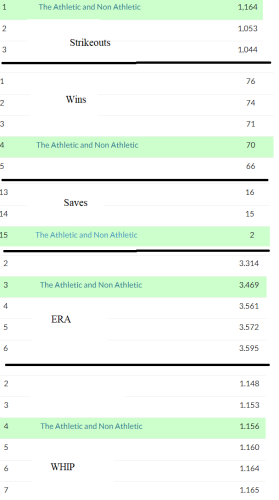
We have a healthy lead in strikeouts and are unwillingly punting saves. We can gain ground in wins.
We're more likely to lose points in ERA, but we could capture a couple of WHIP points. Here is what it would take:
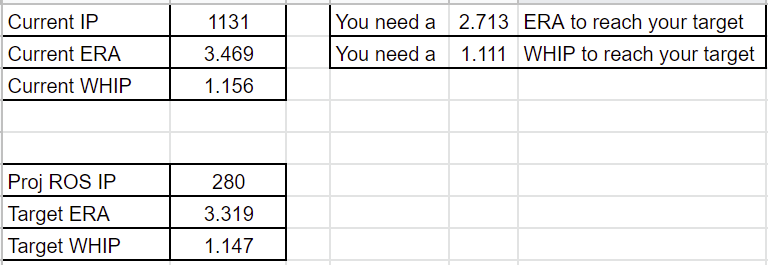
Confirmed - getting the ERA point would take a Herculean effort from our pitching. However, recording a 1.111 WHIP is quite possible. With such a big lead in strikeouts, we could even replace some of the riskier starters with highly skilled relievers. Lowering the innings would lower the target WHIP, but it should increase the chance to achieve the objective. As an aside, The Doughboys are the team just ahead of us in WHIP, so we're looking at a possible three point swing.
The catch is we'd have less of a chance of gaining in wins. Or would we? We're replacing lower ranked starters with relievers. Projecting wins is a crapshoot, but we can target firemen on winning teams, most often used in high-leverage scenarios. It doesn't guarantee we'll vulture some wins, but it increases our chances.
The other benefit of chasing the WHIP points is we're vulnerable in ERA, but if we are successful lowering our WHIP, ERA should dovetail. It likely won't result in gaining points, but playing defense and protecting ERA points is a viable approach.
The pink elephant in this scenario is the Ratio Calculator assumes everyone else will be static, but of course they won't. However, counting categories are also not static. As an example, a team currently six homers behind needs to out-homer the team in front of them by eight just to tie. That is, if both teams maintain their current pace, the final spread will be eight long balls (assuming we're at the three-quarter mark).
Clearly, teams will not maintain their current pace. All this has to be considered when making decisions. My chief goal is convincing you not to categorically dismiss the premise of gaining ratio points. Hopefully, the Ratio Calculator lends a hand.