Balls are flying out of yards all over the country early in the season. Opening Day saw the league tie a record with 46 home runs, and as I write this, the league hit 48 home runs on April 9, including a walk-off shot by known power hitter Jarrod Dyson off elite closer Jose Leclerc.
Simply put, something is up with the baseball again, and we do not need to withhold judgement on this. Buckle your seatbelts, because it is going to be a record-setting year for home runs.
Just over a full calendar year ago, I wrote an installment of this column citing that power was down after a three-year upswing and we should adjust our expectations accordingly. Rather than copy and paste the entire section, I will let you go back and read the piece, but I do want to bring forward a table from that piece:
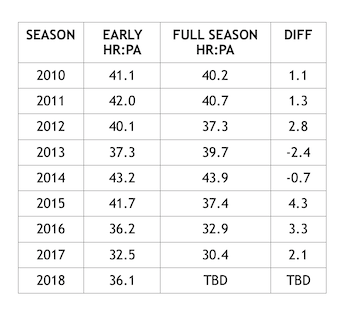
That table shows that the early numbers for home runs per plate appearance have held up very well. I have updated that chart below to show where 2018 ended up and what kind of start we are off to in 2019:
| SEASON | EARLY HR:PA | FULL SEASON HR:PA | DIFF |
|---|---|---|---|
| 2010 | 41.1 | 40.2 | 1.1 |
| 2011 | 42.0 | 40.7 | 1.3 |
| 2012 | 40.1 | 37.3 | 2.8 |
| 2013 | 37.3 | 39.7 | -2.4 |
| 2014 | 43.2 | 43.9 | -0.7 |
| 2015 | 41.7 |
Balls are flying out of yards all over the country early in the season. Opening Day saw the league tie a record with 46 home runs, and as I write this, the league hit 48 home runs on April 9, including a walk-off shot by known power hitter Jarrod Dyson off elite closer Jose Leclerc.
Simply put, something is up with the baseball again, and we do not need to withhold judgement on this. Buckle your seatbelts, because it is going to be a record-setting year for home runs.
Just over a full calendar year ago, I wrote an installment of this column citing that power was down after a three-year upswing and we should adjust our expectations accordingly. Rather than copy and paste the entire section, I will let you go back and read the piece, but I do want to bring forward a table from that piece:
That table shows that the early numbers for home runs per plate appearance have held up very well. I have updated that chart below to show where 2018 ended up and what kind of start we are off to in 2019:
| SEASON | EARLY HR:PA | FULL SEASON HR:PA | DIFF |
|---|---|---|---|
| 2010 | 41.1 | 40.2 | 1.1 |
| 2011 | 42.0 | 40.7 | 1.3 |
| 2012 | 40.1 | 37.3 | 2.8 |
| 2013 | 37.3 | 39.7 | -2.4 |
| 2014 | 43.2 | 43.9 | -0.7 |
| 2015 | 41.7 | 37.4 | 4.3 |
| 2016 | 36.2 | 32.9 | 3.3 |
| 2017 | 32.5 | 30.4 | 2.1 |
| 2018 | 36.1 | 33.1 | 3.0 |
| 2019 | 29.3 | TBD | TBD |
We have not seen the league-wide rate decline after the early start since the 2014 season. In this new era of power, home runs continue to rise in season. The average in-season change over the last four seasons has been 3.2. That would bring the full-season rate down to 26.1. Here is the scary part: the league averages approximately 185,400 plate appearances a season. That number, at a home run every 26.1 plate appearances gives us a decent shot at 7,000 home runs league-wide in 2019. 2017 holds the record at 6,105. All change is not constant, but even the two-point change we saw in 2017 gets us close to 6,800 home runs.
2017 is the most recent memory we have of a power surge, and it was a special year because the 6,105 homers hit that season eviscerated the record 5,693 hit in 2000. The graph below shows how some indicators from each year stack up:
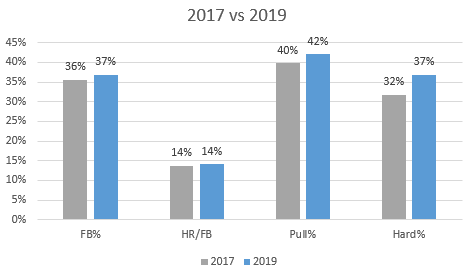
Flyball data is nearly identical, as is the home run to flyball ratio. The difference is the league is pulling a few more balls, but the hard contact is noticeably up this year. To be fair, the HR/FB ratio has a 0.4 percent difference (13.7 vs 14.1, but I rounded the numbers for the graph. The 14.1 HR/FB ratio in 2019 is the highest ever measured. The average exit velocity on all batted balls was 86.7 mph in 2017 and is up to 88.3 mph this season. The average exit velocity on line drives and flyballs in 2017 was 104.3 mph; it is 105 even in 2019.
We have enough early data to tell us something is up with the baseball and that we are going to have a BIG power year this year. Rob Arther of BaseballProspectus wrote about the science behind this last week. He found that the drag coefficient numbers are the lowest recorded in the last calendar year. The 1.3 homers per game that we've seen in games through April 9 is higher than any full season total recorded.
How can you apply this to your fantasy team? If you are hurting for power early, address it quickly. You could find yourself left behind in that category quickly while the rest of the league continues to hit homers at a scary pace. If you had suspect pitching coming into the season, that risky play becomes even more risky once the weather heats up and batted balls have less resistance from Mother Nature. Buckle up, because the Home Run Derby in July could be anti-climatic compared to what we are witnessing to start the 2019 season.