I was reading Ryan Rufe's excellent 2025 Closer Ranking article last week and truly appreciated his thought process in how he worked through the projected save totals for each team. He outlines his process as such:
Step one of my process is forecasting team win and save totals for the 2025 MLB season. First, I aggregated projected 2025 win totals from FanGraphs, one sports book, and Clay Davenport. Then I took the average of each team's save percentage of overall wins from the past three years to project team saves for 2025. Next, I list out probable closer candidates for each team. At the time of this writing, a few notable free-agent closers remain unsigned, including Kenley Jansen, Kyle Finnegan and David Robertson. All four could significantly impact these rankings depending on where they sign and their projected role for that club.
Once I have my initial list of closer candidates by team, I review each player's percentage of team saves from recent seasons. I also consider their history of closing games, the strength of alternate options within each bullpen, leverage index, arbitration and free-agency status, health risk and trade risk before assigning a projected percentage of team saves for 2025. Then I multiply that percentage by the team's total save projection to come up with the player's individual save projection.
This is a great process for figuring out how to project saves, as Ryan goes on to look at the save share rate for each closer. For
I was reading Ryan Rufe's excellent 2025 Closer Ranking article last week and truly appreciated his thought process in how he worked through the projected save totals for each team. He outlines his process as such:
Step one of my process is forecasting team win and save totals for the 2025 MLB season. First, I aggregated projected 2025 win totals from FanGraphs, one sports book, and Clay Davenport. Then I took the average of each team's save percentage of overall wins from the past three years to project team saves for 2025. Next, I list out probable closer candidates for each team. At the time of this writing, a few notable free-agent closers remain unsigned, including Kenley Jansen, Kyle Finnegan and David Robertson. All four could significantly impact these rankings depending on where they sign and their projected role for that club.
Once I have my initial list of closer candidates by team, I review each player's percentage of team saves from recent seasons. I also consider their history of closing games, the strength of alternate options within each bullpen, leverage index, arbitration and free-agency status, health risk and trade risk before assigning a projected percentage of team saves for 2025. Then I multiply that percentage by the team's total save projection to come up with the player's individual save projection.
This is a great process for figuring out how to project saves, as Ryan goes on to look at the save share rate for each closer. For example, he has Josh Hader and Emmanuel Clase each earning 85 percent of their respective team saves. This is much more precise than simply looking at how many wins also include saves for each club each season, because the leaguewide average has been 51 percent over the past four seasons and 50 percent if we go back to 2010. If we simply used half a team's projected win total for saves, it would only get us, pardon the pun, halfway there. What we really need to know is how teams are getting to that end goal. Technology folks might recognize the term, "Frankenstack," as it describes how an IT shop may put together different solutions in their digital ecosystem to meet company requirements. Bullpens are no different, because we rarely see one solution (closer) get all the saves, though one guy nearly pulled that off last season.
In 2024, the primary closers collectively garnered 61 percent of their team's saves, led by Kyle Finnegan earning all but two of the 40 saves for the Nationals, while Tyler Kinley earned just 32 percent of the saves for the Rockies:
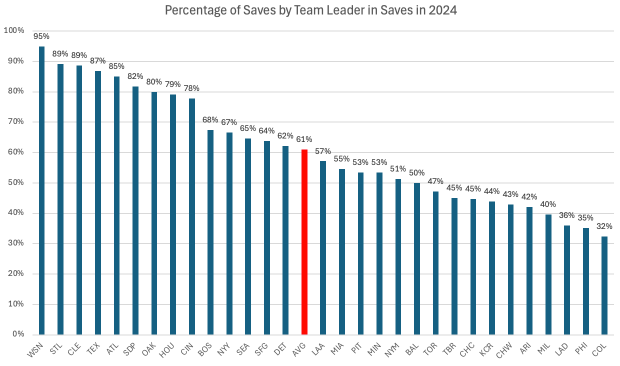
There are several reasons for teams coming in below the league average. The Angels traded their closer before the deadline, while several other teams had their primary closer suffer an injury or simply become ineffective, as was the case with the Pirates and Cubs, respectively. Other teams, such as the Royals, traded for upgrades at closer, but then we look at the Twins, who mostly had healthy Jhoan Duran yet he only earned 25 of the team's 43 saves. What is important to learn is how these teams frankenstacked their way to their save totals last season.
Thanks to the skills of my local league commissioner and RotoWire subscriber Rob M., here are the stacks from each bullpen, which also includes the league-wide totals in the last column. The primary closers for the National League earned 59.1 percent of the saves, while the American League primary closers accounted for 63.0 percent of the save totals:
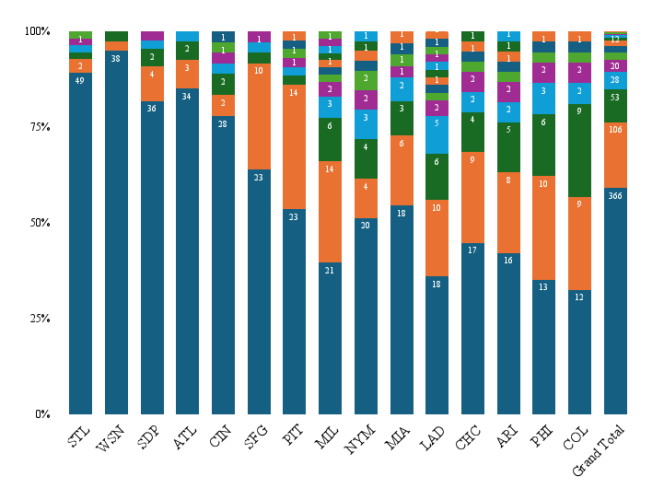
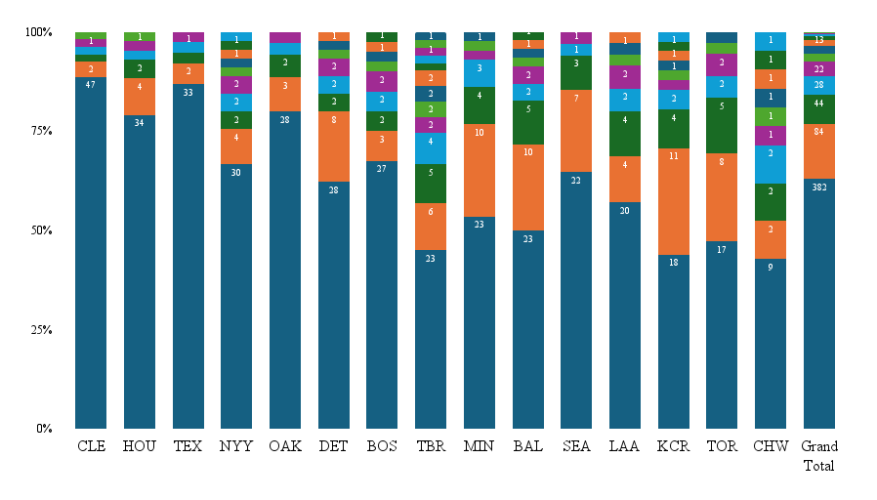
That means just over a third of the saves in the American League were from secondary sources, while just over 40 percent of the saves in the National League were from secondary sources. After all, we're coming off a season where we saw 10 different relievers who were drafted after pick 200 in Draft Champions leagues go on to earn at least 15 saves:
| Name | Team | 2024 SV | 2024 DC ADP |
|---|---|---|---|
| Ryan Helsley | STL | 49 | 93 |
| Emmanuel Clase | CLE | 47 | 52 |
| Kyle Finnegan | WSN | 38 | 233 |
| Robert Suarez | SDP | 36 | 211 |
| Josh Hader | HOU | 34 | 46 |
| Raisel Iglesias | ATL | 34 | 59 |
| Kirby Yates | TEX | 33 | 558 |
| Clay Holmes | NYY | 30 | 108 |
| Jason Foley | DET | 28 | 494 |
| Alexis Diaz | CIN | 28 | 74 |
| Mason Miller | OAK | 28 | 215 |
| Kenley Jansen | BOS | 27 | 123 |
| Craig Kimbrel | BAL | 23 | 119 |
| Pete Fairbanks | TBR | 23 | 91 |
| David Bednar | PIT | 23 | 68 |
| Jhoan Duran | MIN | 23 | 57 |
| Camilo Doval | SFG | 23 | 56 |
| Andres Munoz | SEA | 22 | 84 |
| Trevor Megill | MIL | 21 | 587 |
| Carlos Estevez | LAA | 20 | 223 |
| Edwin Diaz | NYM | 20 | 43 |
| Tanner Scott | MIA | 18 | 103 |
| Evan Phillips | LAD | 18 | 93 |
| James McArthur | KCR | 18 | 336 |
| Hector Neris | CHC | 17 | 459 |
| Chad Green | TOR | 17 | 672 |
| Paul Sewald | ARI | 16 | 85 |
Finnegan and Suarez were both considered the primary closer, at least on paper, to begin the season, but many were speculating on other options in the pen. Hunter Harvey was going at pick 270 while Yuki Matsui was going at 302, which spoke to the market confidence on the closing situations in Washington and San Diego. Yates was an afterthought in Texas as a late signee, and the situation in Detroit was about as wide open as it stands now, yet look what Foley did with his opportunity.
I am still very intrigued to see where Jansen, Finnegan and Robertson land in the coming weeks. Jansen's recent ADP is 182, while Finnegan is at 334 and Robertson comes in at 383. Texas would be an ideal landing spot for any of them for fantasy purposes given how much preference was given to Yates, while any of them could certainly answer some questions about who is going to do what in Detroit. The Nationals, a team who many are considering a dark horse for 2025, could absolutely use someone after enjoying Finnegan's efforts last season, and whomever gets that role should enjoy heavy usage. If Jordan Romano's body isn't 100 percent recovered from last year's debacle, the Phillies could once again be frankenstacking their way to saves, but bringing back Robertson could help that situation as well.
In short, we're a long ways away from the days of set-it-and-forget-it closers. Last season, just over 40 percent of saves came from secondary sources, and it's always better to identify those sources on draft day rather than being forced to chase them all season with your free agent acquisition budget.