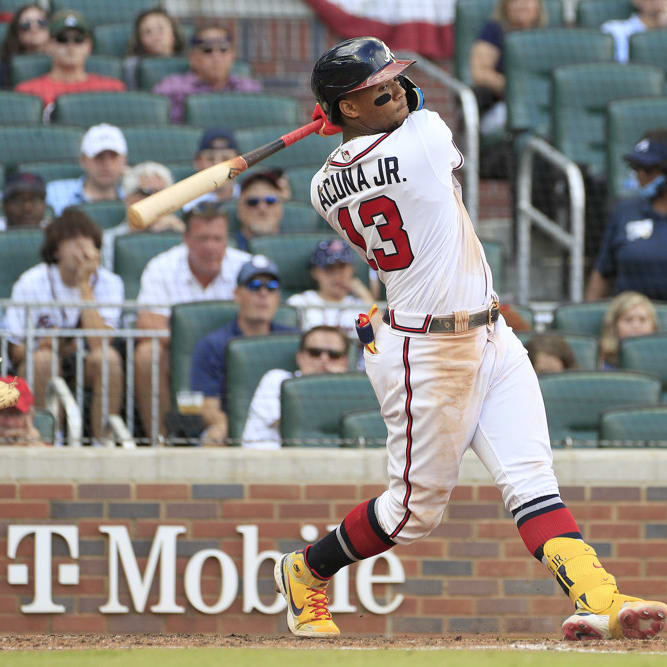

Matt Olson and Brandon Crawford both had their own one-of-a-kind breakouts last season. Olson saw his strikeout rate drop from 31.4% to 16.8% last season. The drop of nearly 15 percentage points allowed him to have the best season of his career, producing 100 runs and RBI (for the first time) with 39 homers and a .271 average. Crawford saw his OPS go from .654 to .792 to .895 from his age-32 to age-34 seasons. These are Barry Bonds steroid-level improvements. It's tough to know how sticky they'll be.
With these extreme breakouts I failed to find many similar players but came up with a few ways to deal with these unicorns. Starting with Matt Olson, I looked for hitters who dropped their strikeout rate by 14 percentage since 2006 (post-PED) who had at least 200 PA in the first season and 600 PA in the next. Besides Olson, no one at all met this requirement.
I wanted to try to keep the plate appearances similar since being able to keep up the improvement for an entire 600 PA is a different story than 100 PA. I dropped the second plate appearance threshold down to 300 PA to get my first comp (Jarrod Saltalamacchia from 2009 to 2010). If I drop both plate appearances totals down to 100, a couple more players show up (Jason LaRue 2008-2009, Tommy Pham 2017-2018). Great, three comps and two are catchers.
I decided to back track and start lowering the strikeout rate. At
Matt Olson and Brandon Crawford both had their own one-of-a-kind breakouts last season. Olson saw his strikeout rate drop from 31.4% to 16.8% last season. The drop of nearly 15 percentage points allowed him to have the best season of his career, producing 100 runs and RBI (for the first time) with 39 homers and a .271 average. Crawford saw his OPS go from .654 to .792 to .895 from his age-32 to age-34 seasons. These are Barry Bonds steroid-level improvements. It's tough to know how sticky they'll be.
With these extreme breakouts I failed to find many similar players but came up with a few ways to deal with these unicorns. Starting with Matt Olson, I looked for hitters who dropped their strikeout rate by 14 percentage since 2006 (post-PED) who had at least 200 PA in the first season and 600 PA in the next. Besides Olson, no one at all met this requirement.
I wanted to try to keep the plate appearances similar since being able to keep up the improvement for an entire 600 PA is a different story than 100 PA. I dropped the second plate appearance threshold down to 300 PA to get my first comp (Jarrod Saltalamacchia from 2009 to 2010). If I drop both plate appearances totals down to 100, a couple more players show up (Jason LaRue 2008-2009, Tommy Pham 2017-2018). Great, three comps and two are catchers.
I decided to back track and start lowering the strikeout rate. At at 12-percentage-point drop, Justin Smoak (2017-2018). At a 10-percentage-point drop, David Ortiz (2011-2012) joins along with Jorge Soler from this past season (34% to 24%). To get 10 comps, I had to drop the second threshold down to 300 PA and keep the strikeout rate drop at 10 percentage points.
I'm just not getting anything close to what Olson did, so I'll move on to Crawford.
For Crawford, I set the requirements as being 30 or older with a 200-point improvement in OPS over two seasons. One name immediately hit: Jayson Werth (2011 to 2013). Hitters just don't see major improvements in their 30s.
As I started looking into Olson and Crawford, I expected long lists of comparable players and a lot of data regarding how those players regressed back to their norms and the league norms. The problem is that a sample of one to even a dozen players tells us very little and is not predictive in any way.
Small samples always show up and it's tough to know how to deal with them. When Nolan Arenado signed with the Cardinals, the big unknown was how much of Arenado's production would decline. He immediately got slapped with a Matt Holliday comp since both went from the Rockies to the Cardinals. Holliday was still good in St. Louis (.293/.380/.494) but just not as good as he was in Colorado (.319/.387/.550). Almost all of the decline was in batting average.
For Arenado, he saw almost the same decline, going from .293/.349/.541 down to .255/.312/.494. Again, almost all of the decline was batting average driven. In this instance, the single example was in the ballpark. The problem was that the only possible answers were binary, the results were either going to be similar or not. A 50/50 proposition.
Another example was when I started looking into how Yu Darvish might age. I was hoping to find pitchers the same age who threw just as hard and had similar injury histories. The only 34-year-old starters since 2008 to average throwing over 94.5 mph were Charlie Morton, Justin Verlander and Max Scherzer. Two future Hall of Famers and currently one of the dozen or so best arms in the game. It's a sample of three great pitchers. Darvish isn't a slouch, but it would be nice to have some lesser arms for comparison.
As fantasy managers, there are several ways to value these unicorns.
First of all, I'm completely against using just a handful or fewer examples. I'm not basing any 2022 fantasy decision on Jayson Werth's 2013 season.
The most obvious solution is to just ignore the few unicorns in the forest. When something can't easily be explained, let someone else (e.g. this author) take on the task of trying to correctly value the unknown.
Instead, a fantasy manager can focus on the known and be fine with missing out. With only 10% or less of the player pool being rostered by any fantasy team at a time, there are plenty of options available.
The final option would be to loosen the requirements and assume the results from a non-ideal player pool. In Matt Olson's example, the plate appearance requirement could be loosened so it's 100 PA in any matched season. If this is done, the sample grows to 20 players with the average strikeout rate regressing up by four percentage points. Olson's projection will be close enough.
There will always be some unique event(s) each season with no way to know who will be involved and in what way. That unknown is just part of what makes this game great. With so much going on in the game, it is generally a waste of time diving into predicting the effects of these one offs. Worry about the 99% that can be explained.