A couple of weeks ago, I discussed hitting category targets for the NFBC and TGFBI. This is the pitching companion piece, one I last did two years ago. As with the hitting categories article, we're dealing with the problem of trying to hit a moving target. The run environment is different every year, and often significantly different. Yet we can still find a few trends that aid us in our quest to optimally structure our draft.
Let's look first at the general pitching environment by looking at league-wide stats:
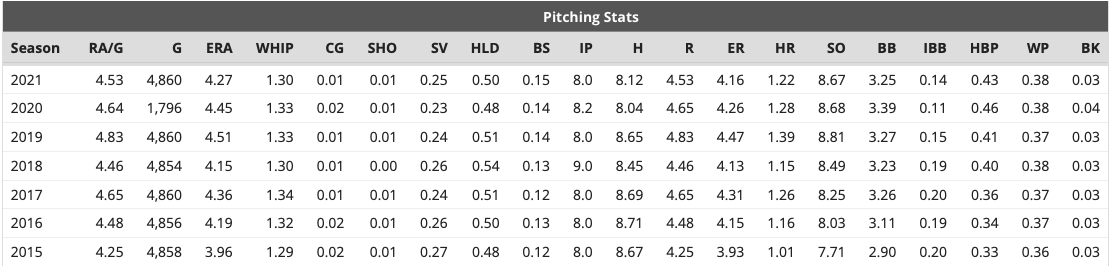
As we saw with the hitting article, the offensive environment was down a bit last season, though that manifested itself a little differently when it comes to attacking the pitching categories. Strikeouts actually took a step back the last two seasons, which shouldn't have been a shock in 2020 when we had a universal DH, but it was a small surprise last year. Keep in mind that "a step back" is still the third highest rate ever - strikeouts are still so important to attack throughout the season and through every pitching spot on your roster. We'll see how that manifested itself in our leagues, as well as how each category adjusted.
Just like the hitting categories article, we'll use data from 2021, 2019 and 2018 (the last three full seasons), and eschew the 20th percentile results. In an overall contest, you're probably in pretty bad shape if you're in that range in any category.
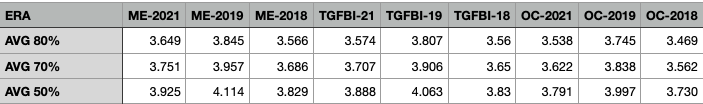
ERA
ME = NFBC Main Event
A couple of weeks ago, I discussed hitting category targets for the NFBC and TGFBI. This is the pitching companion piece, one I last did two years ago. As with the hitting categories article, we're dealing with the problem of trying to hit a moving target. The run environment is different every year, and often significantly different. Yet we can still find a few trends that aid us in our quest to optimally structure our draft.
Let's look first at the general pitching environment by looking at league-wide stats:
As we saw with the hitting article, the offensive environment was down a bit last season, though that manifested itself a little differently when it comes to attacking the pitching categories. Strikeouts actually took a step back the last two seasons, which shouldn't have been a shock in 2020 when we had a universal DH, but it was a small surprise last year. Keep in mind that "a step back" is still the third highest rate ever - strikeouts are still so important to attack throughout the season and through every pitching spot on your roster. We'll see how that manifested itself in our leagues, as well as how each category adjusted.
Just like the hitting categories article, we'll use data from 2021, 2019 and 2018 (the last three full seasons), and eschew the 20th percentile results. In an overall contest, you're probably in pretty bad shape if you're in that range in any category.
ERA
ME = NFBC Main Event (15 teams)
TGFBI = The Great Fantasy Baseball Invitational (15 teams)
OC = RotoWire Online Championship (12 teams)
As expected, our ERA targets were lower in 2021 with the ball being at least partially deadened, at least compared to that of the 2019 Happy Fun Ball Era. But it's not even down to 2018 levels, let alone to 2015 when we last had a full season with less of an emphasis of increased launch angle and/or a more lively ball. Still, a top 80th percentile ERA required you to roster a staff that collectively was a half-run better than a league-average pitcher. Your starters are typically going to throw three times as many innings as your relievers - at least that's the case with your top starters.
WHIP
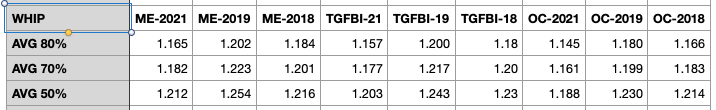
Even though league-wide ERA's didn't track all the way back to 2018, the number baserunners allowed by our fantasy pitchers did and then-some. In fact, the 70th percentile WHIP in each contest was lower than the 80th percentile in 2018. Batting averages are down, and last year the league-wide walk-rate decreased. That will likely reverse itself this year, assuming that baseball institutes the universal DH. Nonetheless, it might behoove you to pay particular attention to pitchers that keep their walk-rates down this year.
Strikeouts
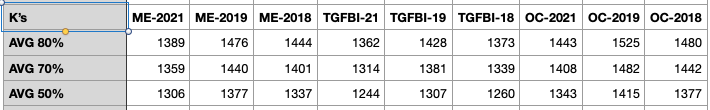
I have to admit, I'm shocked by these numbers. In fact, I had to double check to make sure I was reading the data correctly. But then I thought about it more - this is a direct result of MLB cracking down on grip-enhancement midway through the season. We all saw the reports of decreasing spin-rates after the crackdown, so this is what follows. I'd suspect that the rates might even drop a little more in 2022, if MLB maintains its emphasis for a full season, along with the possible re-introduction of the universal DH. But then in 2023 and beyond, I'd expect strikeouts to resume it's slow northward climb, so slow down on those Kyle Hendricks and Dallas Keuchel builds. Even if you only need 1,350 K's to attain the 80th percentile, that's still on average 150 K's per active pitcher slot, and you're likely to use 2-3 of those spots on relievers.
Wins
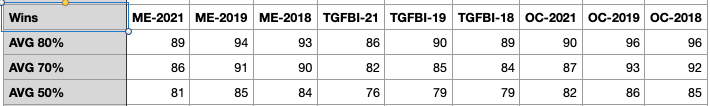
Welcome to the land of the incredible shrinking wins. As the game becomes more optimized, fewer wins are being awarded/earned by starting pitchers. Our starters are getting pulled from games sooner, and many teams aren't as adept as the Rays at employing openers. Thus there are fewer Ryan Yarbrough 16-win seasons out there.
How do we handle this information? For starters, we need to apply one caveat. So many teams discussed limiting their starters last year, in the wake of only playing 60 games the year before. So it's possible that not all of the decline in wins rostered in our leagues is the result of optimization, but rather a combination of that plus injury caution. Moreover, more players logged IL trips than ever, meaning that our top pitchers were less available, and in many cases they had mid-week injuries that left dead roster slots active. Still, I suspect these trends are unlikely to reverse significantly. It might end up meaning that rostering the top non-closer relievers (see for example Chad Green, who logged 10 wins, seven saves and 99 strikeouts) is more advantageous than ever. This is especially true when we look at saves.
Saves
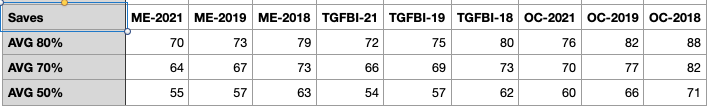
The number of saves in baseball are relatively constant, but the number of those saves on our active roster continue to decline. Once again, blame the Rays! They had 14 different pitchers convert save chances, led by Diego Castillo, who of course got dealt at the trade deadline. No other Rays reliever had more than eight saves. This from a team that won 100 games! The Reds had 10 different pitchers convert saves, with no single pitcher getting more than eight. Of course, they traded Raisel Iglesias before the start of the season, and then many of their alternatives either got hurt (Lucas Sims, Tejay Antone) or struggled (Amir Garrett, Sean Doolittle). Their saves leaders ended up getting cut (Heath Hembree) or began on a different team (Mychal Givens). Good luck finding a profit in that.
We're already seeing that closer uncertainty result in higher draft prices on the remaining solid closer options in early 2022 drafts. You'd better be prepared to pay a second-round price if you want to roster Liam Hendriks or Josh Hader, or a third-round pick in most 12-team drafts if you want Iglesias. Most of the results I'm referring to have been in draft-and-hold leagues rather than in FAAB leagues. In the latter format, at least you can try to find some help off the waiver wire. But I expect even when we reach March, closer prices might still be a full round higher than they were in similar drafts last year.
Should you consider punting the scarce category? Not if you have any designs of winning or cashing in the overall Main Event. Of the top 20 teams in that contest, only one team had less than the 50th percentile in saves, and he finished 19th overall while logging 43 saves. One other team in the top 20 had fewer than 60 saves, and they finished 10th overall in the contest while posting 58 saves. I've been rostering at least one closer in the top 10 rounds in my drafts so far, and often two - the latter is a departure from my usual draft approach. That said, I've done four draft-and-hold leagues so far this year, and no leagues with free agents to add. But I'm persuaded that I want security in this category instead of chasing them on the waiver wire.
As always, remember your results will vary in your home leagues, when there's no overall contest, and often where you can trade. But if you're playing in an overall contest, hopefully these results will give you a starting point in setting your targets, if not an overriding strategy.