
When putting last season's pitching numbers under the microscope, noting any changes pre- and post-checking for grip enhancers seems like relevant information. While it's true each pitcher reacted in a different manner, it's necessary to have a big-picture perspective to serve as a foundation. That is, globally, how were spin rates affected and did the change alter performance?
This seems like a straightforward question to answer, but in order to reduce the variables to just the spin rate, the trend from previous seasons needs to be examined. For example, it's assumed spin rates fell after the umpires began their spot checks, but if spin rates fall organically as the season progresses, the drop is more than just from adjusting grips, etc.
Similarly, if homers or strikeouts change over the course of the season, that needs to be accounted for when investigating how the change in spin influenced homers or strikeouts. As such, not only do spin rates from the past few seasons need to be charted, but so do the ensuing performance metrics.
Guess who has been pulling data and dusting off their Excel graphing skills?
Let's start by defining the parameters. Each season was parsed into the following six segments:
- Opening Day to April 30
- May
- June 1 to June 20
- June 21 to the All Star break
- All-Star break to August 31
- September 1 to end of the season
The league announced it would commence searching for sticky stiff on June 21, but some pitchers may have gotten
When putting last season's pitching numbers under the microscope, noting any changes pre- and post-checking for grip enhancers seems like relevant information. While it's true each pitcher reacted in a different manner, it's necessary to have a big-picture perspective to serve as a foundation. That is, globally, how were spin rates affected and did the change alter performance?
This seems like a straightforward question to answer, but in order to reduce the variables to just the spin rate, the trend from previous seasons needs to be examined. For example, it's assumed spin rates fell after the umpires began their spot checks, but if spin rates fall organically as the season progresses, the drop is more than just from adjusting grips, etc.
Similarly, if homers or strikeouts change over the course of the season, that needs to be accounted for when investigating how the change in spin influenced homers or strikeouts. As such, not only do spin rates from the past few seasons need to be charted, but so do the ensuing performance metrics.
Guess who has been pulling data and dusting off their Excel graphing skills?
Let's start by defining the parameters. Each season was parsed into the following six segments:
- Opening Day to April 30
- May
- June 1 to June 20
- June 21 to the All Star break
- All-Star break to August 31
- September 1 to end of the season
The league announced it would commence searching for sticky stiff on June 21, but some pitchers may have gotten a head start and eschewed any enhancement they were using earlier, hence the June 1 to June 20 data point. Post-spot check was broken into two time frames to observe any change following the initial onset. Sure, the dates are somewhat arbitrary, but they suffice to reveal what we want to know.
Data was collected for the three pitches relying most on spin:
- Four-seam fastball
- Curveball
- Slider
With that as a backdrop, here is what happened last season, in graphical form:
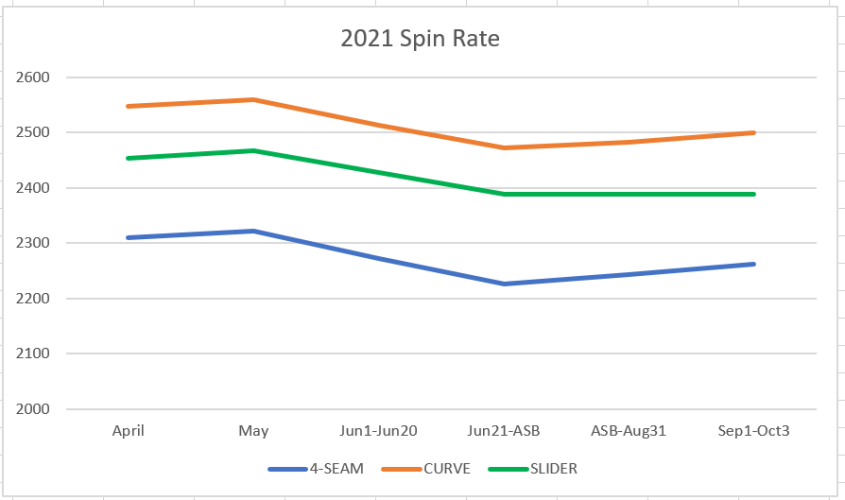
Admittedly, reading the data is a bit tricky, so let's walk through the results. The point labeled April is the average rates from opening day through April 30. The May point is the average in May. The rates for all three offerings ticked up. The third point encompasses when the league announced it would begin checking in about three weeks The average spin rates fell for all three pitches. Next is the time from June 21 (the first day of spot checks) through the break. Spin rates continued to fall. Don't read anything into how all three are straight lines from May through the break as the time lengths in the X-axis aren't all the same. Still, the downward trend suggests some hurlers adjusted during the notice period while more waited until they began searching.
Curiously, the four-seam and curve spins almost reverted to April's level by the end of the season while the slider dipped a smidge more. Here is why understanding what normally occurs is pertinent. Maybe spin always picks up over the second half.
Here is the data for 2019 and 2018.
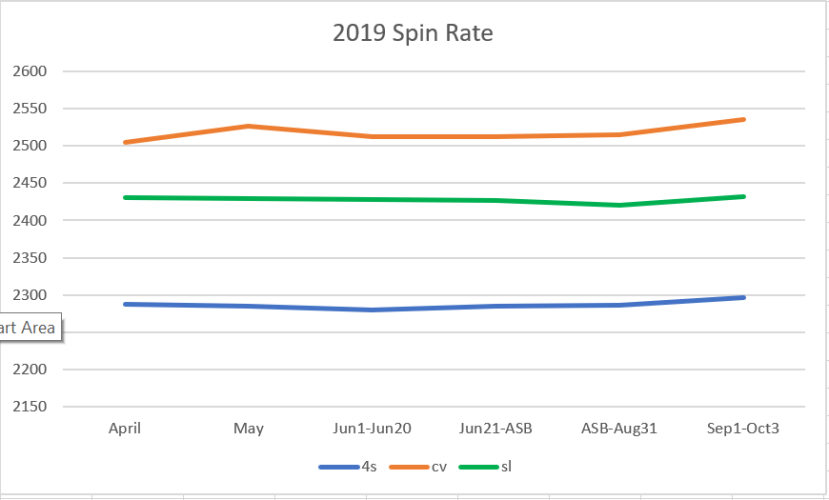
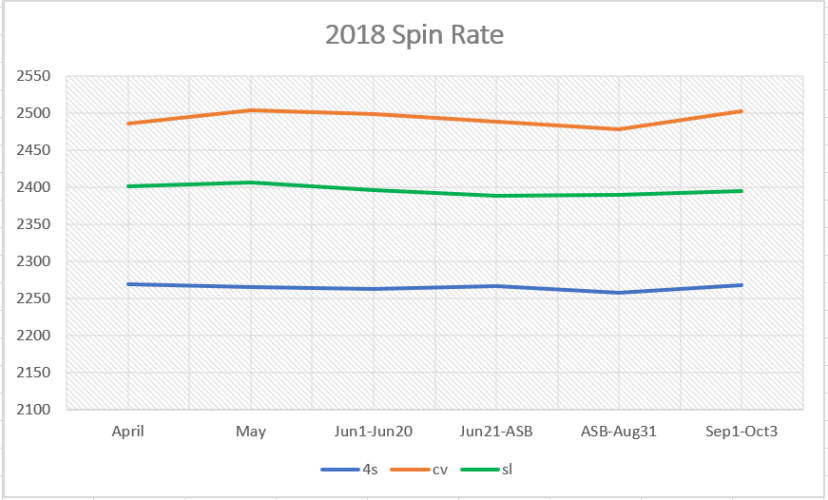
Something to keep in mind is the September rosters were different in 2018 and 2019 so some extraneous variables remain. The biggest takeaway from comparing the three seasons is the 2021 drops were entirely due to the cracking down on grip enhancers, as spin stayed pretty steady in the two prior full campaigns. It can be argued some of the reversion in September was organic since the rates in the final month of 2018 and 2019 edged up, but it's unclear if this is related to more relievers available with 40-man rosters.
Next up is examining how several metrics trended over the course of the season, using the same six time frames. The following are investigated:
- ERA
- WHIP
- wOBA
- K%
- BB%
- BABIP
- HR%
Observations will follow each chart, with a summary after all six have been presented.
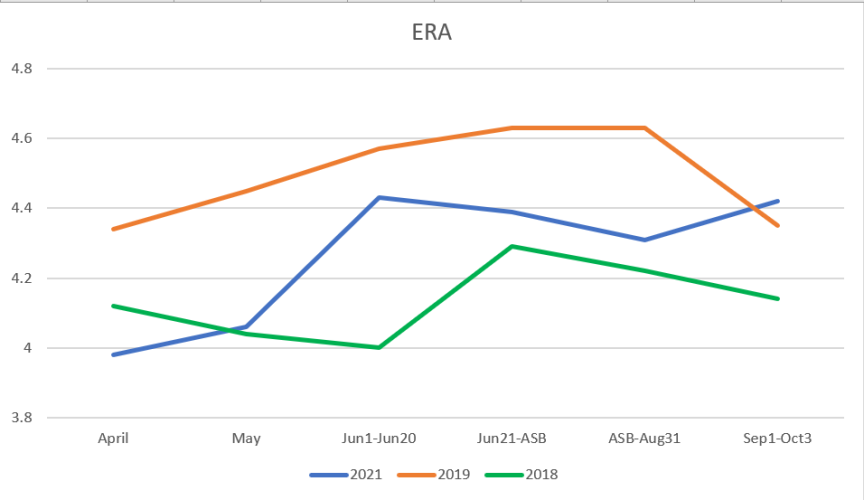
ERA is subject to the whims of fate, but the hope is that luck evens out with all 30 teams sampled. Conventional wisdom has ERA trending upward as the weather warms up. That wasn't the case in 2018, but 2019 followed weather trends closely. Last season, run scoring spiked almost half a run from June 1 through June 20, suggesting the performance of those adjusting early suffered, but then ERA began to improve before jutted back up in September. This could also be due to fewer pitchers being available in the final month, so overworked bullpens were hit harder.
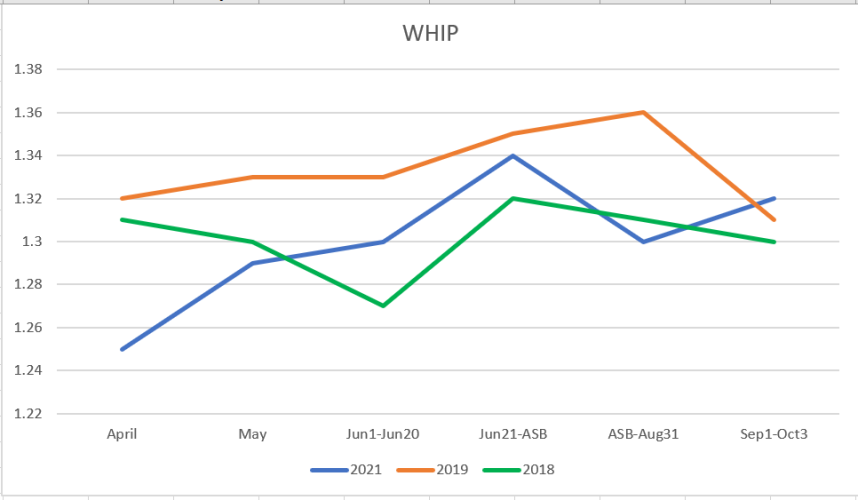
Here is a perfect example why a single season's results can't be evaluated in a vacuum. Focusing just on 2021, it can be surmised the spike from June 1 - June 20 was due to less spin leading to more hits and walks, but a similar jump occurred in 2018. In 2019, WHIP inched up from the break until the end of August, while it fell during that period in 2018 and last season.
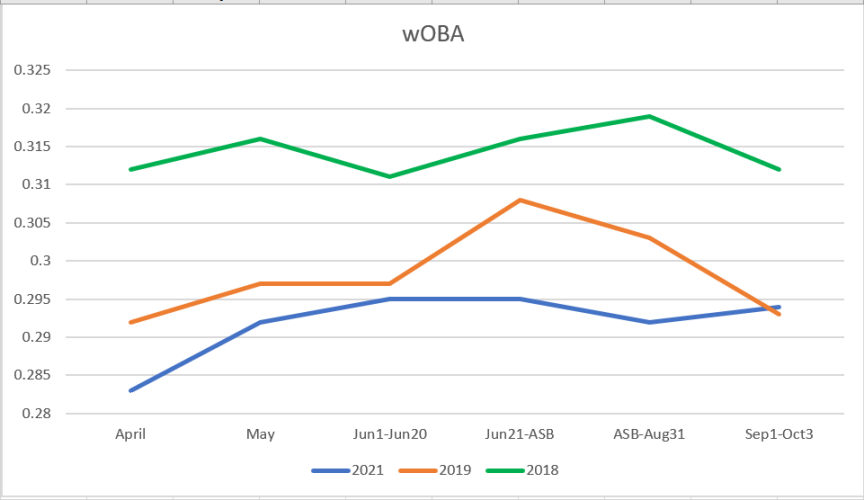
Intuitively, wOBA should mirror ERA since it's designed to be a proxy for run production, but that doesn't appear to be the case. This speaks towards the variance associated with ERA.
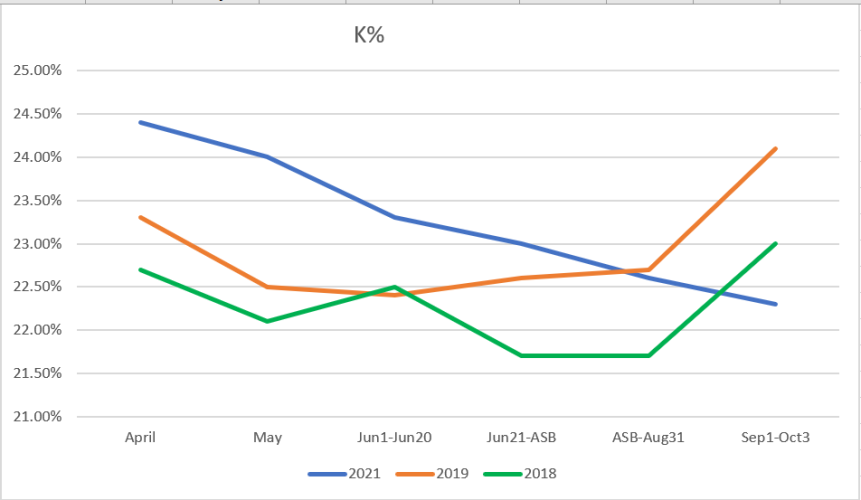
OK, now we're getting somewhere. The first of the three basal skills shows a steady decline all of last season. The early drop matches what happened in 2018 and 2019. The May K-rate picked up in 2018, but it continued to dip in 2019 and last season. The telltale data is from June 21 through the break. In 2018 and 2019, strikeouts leveled off or inched up, but last season they continued to slide, suggesting a drop in spin hurt strikeouts.
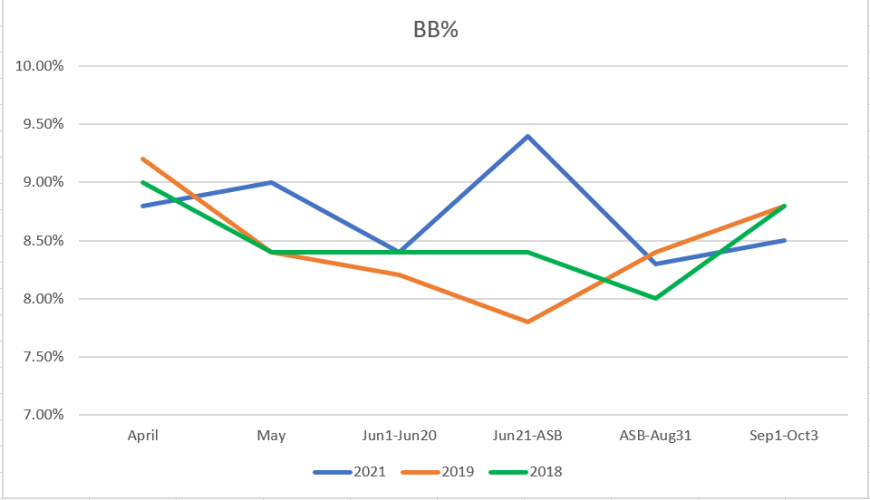
This is interesting. Walks scooted up in early June last season. Perhaps it was happenstance, but the data from 2018 and 2019 suggests it was due to some pitchers lacking their normal grip. However, once umpires started their checks, walks fell to a season low. One reason could be more balls were put in play. Even so, those two data points seem contradictory, since more balls should have been put in play in early June as well. Last season's WHIP and BB% follow similar trends, but there is another component of WHIP.
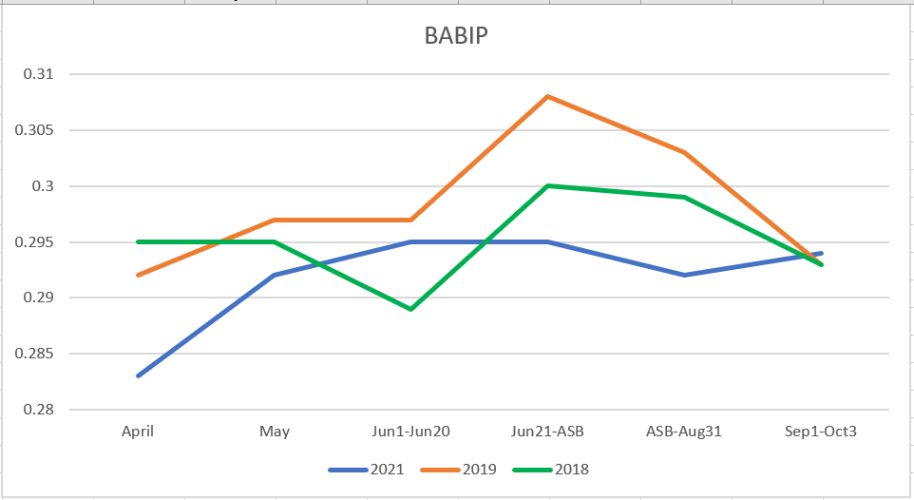
Remember the uproar early last season? All the talk was about the new ball and how offense was down. It took awhile, but it's interesting that BABIP for the last month was similar in all three seasons.
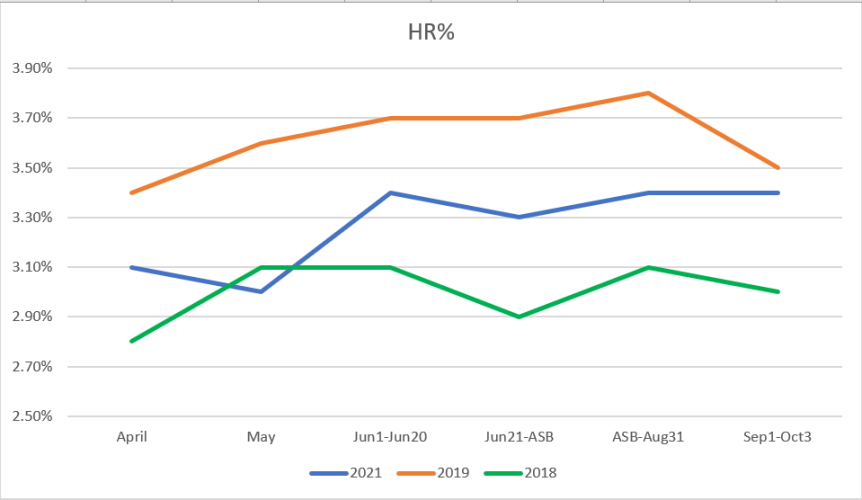
Two things stand out here. First, homers dovetail with ERA, which makes sense. More relevant to the question at hand is homers dropped when pitchers first started adjusting for the spot checks, then they increased, but only slightly. Shouldn't one of the fallouts from less spin be more homers? It may be hitter's muscle memory took some time to adjust to less movement in pitches. That is, they recognize curve or slider spin, thus anticipate where the pitch will end up, but since it doesn't move as much, they fail to square it up.
Before drawing any conclusions regarding the effect of less spin, let's overlay all seven metrics for each season to get a feel for usual trends. To do this, each metric was normalized to start at 100, then each time point was scaled accordingly. Here is 2018.
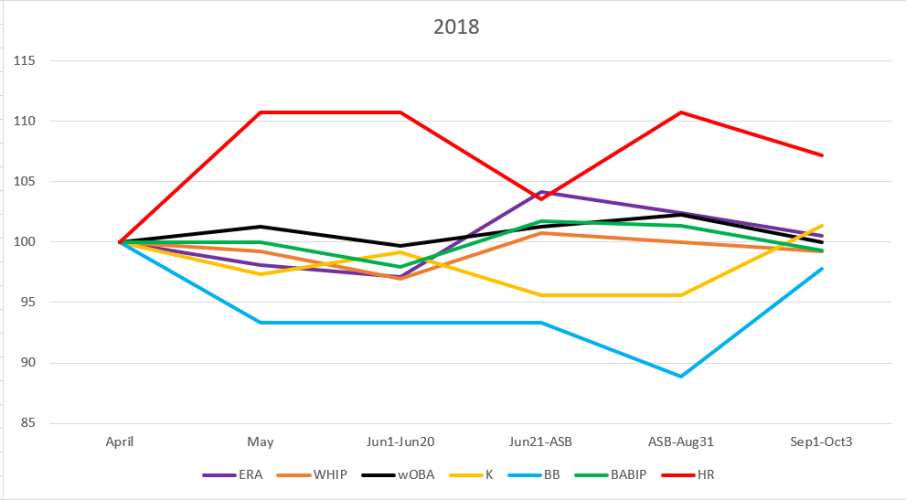
Admittedly, it's hard to see, but BABIP appears to mirror ERA pretty well. Surprisingly, there doesn't appear to be a lot of correlation between homers and ERA. Again, tough to visualize, but strikeouts and ERA seem to be inversely correlated.
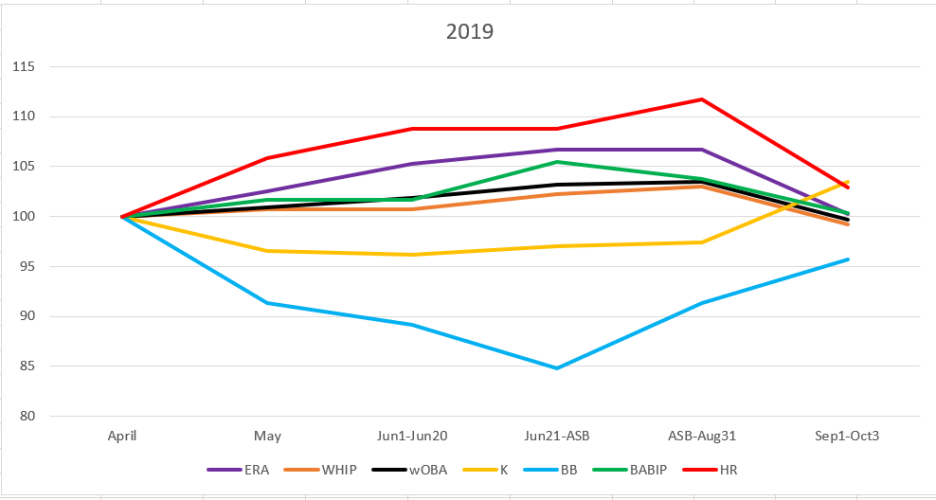
Interesting, here homers piggyback ERA more than the previous campaign. The same inverse relationship occurs with strikeouts and ERA.
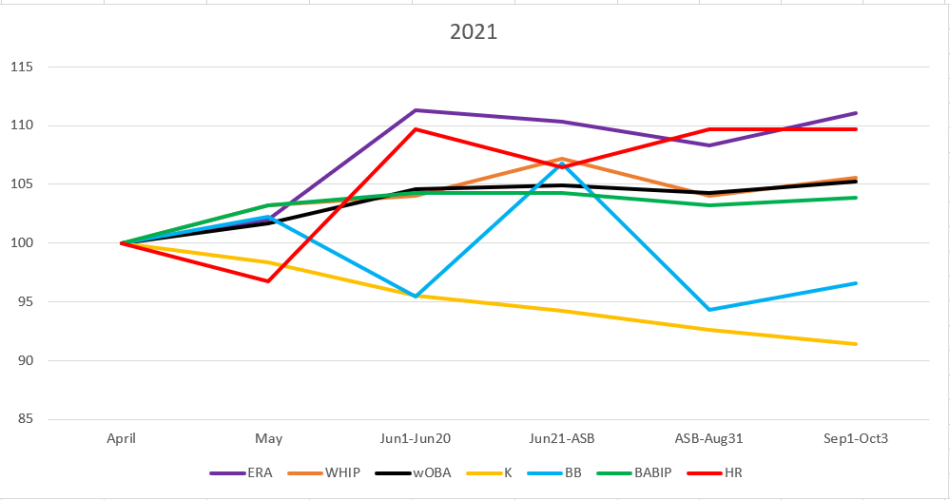
This time, strikeouts are on their own while homers and ERA follow similar trends.
Confession time: These graphs are not as telling as I hoped. Some people are more visual and may be gleaning more than me. I like numbers.
What follows is a summary of all the possible correlations for the seven metrics studied. The correlation measures how well each of the above lines correlate on a yearly basis. This is carried out for all three seasons and the respective correlations are averaged. The table is sortable, so you can see which correlations were the highest each season. By means of reminder:
- 1: perfect correlation, the trends are in perfect sync
- -1: perfect inverse correlation
- 0: perfectly random relationship
| 2021 | 2019 | 2018 | AVG | ||
|---|---|---|---|---|---|
| 1 | WHIP and BABIP | 0.887 | 0.883 | 0.919 | 0.897 |
| 2 | wOBA and BABIP | 0.882 | 0.917 | 0.818 | 0.872 |
| 3 | ERA and BABIP | 0.842 | 0.893 | 0.879 | 0.871 |
| 4 | ERA and WHIP | 0.821 | 0.901 | 0.841 | 0.854 |
| 5 | ERA and wOBA | 0.981 | 0.980 | 0.570 | 0.844 |
| 6 | WHIP and wOBA | 0.886 | 0.967 | 0.579 | 0.811 |
| 7 | wOBA and HR% | 0.865 | 0.922 | 0.302 | 0.696 |
| 8 | K% and BB% | 0.353 | 0.674 | 0.813 | 0.613 |
| 9 | ERA and HR% | 0.903 | 0.951 | -0.394 | 0.487 |
| 10 | BABIP and HR% | 0.571 | 0.792 | -0.275 | 0.362 |
| 11 | WHIP and HR% | 0.565 | 0.851 | -0.551 | 0.288 |
| 12 | WHIP and BB% | 0.252 | -0.650 | 0.033 | -0.122 |
| 13 | BB% and BABIP | -0.007 | -0.859 | -0.353 | -0.406 |
| 14 | ERA and BB% | -0.247 | -0.860 | -0.215 | -0.440 |
| 15 | wOBA and BB% | -0.200 | -0.781 | -0.759 | -0.580 |
| 16 | K% and HR% | -0.856 | -0.673 | -0.235 | -0.588 |
| 17 | WHIP and K% | -0.766 | -0.669 | -0.428 | -0.621 |
| 18 | K% and BABIP | -0.699 | -0.579 | -0.738 | -0.672 |
| 19 | BB% and HR% | -0.528 | -0.804 | -0.718 | -0.684 |
| 20 | ERA and K% | -0.859 | -0.741 | -0.530 | -0.710 |
| 21 | wOBA and K% | -0.916 | -0.703 | -0.871 | -0.830 |
Much better! Before focusing on 2021, here are some global observations.
BABIP dominates the positive correlations: as BABIP goes, so goes ERA, wOBA and WHIP. The catch is BABIP is subject to a lot of variance in a small sample so it follows ERA, wOBA and WHIP are as well.
K% drives the negative correlations. More strikeouts result in a lower ERA, wOBA, BABIP and WHIP. This is intuitive, but the extent is stronger than expected, at least to me. It serves to reinforce the need for successful pitchers to miss bats. Not only are strikeouts a category, but the influence ERA and WHIP. This corroborates my research showing winning fantasy teams score the highest in the strikeout category.
The 2018 ERA to HR% correlation is wacky. In 2019 and 2021, the correlation was the second strongest to wOBA and ERA. While the reason could be interesting, it's not relevant to the study at hand, other than to say oddities could occur, skewing expectations.
Let's turn attention to 2021 and declining spin. Strikeouts steadily dropped, so according to the table, ERA and WHIP should have risen. They did, expect the trend was more jagged than the smoother pathway of the strikeout decline. Something must have forced the steep ERA increase from June 1 through June 20. Still, the main takeaway is unless pitchers adjust, or MLB introduces the tackier ball, strikeouts are likely to dip, with run scoring increasing.
Looking at the HR% from 2021, it's clear long balls were the reason for the big ERA spike from June 1 to June 21. While some of this could be explained from some pitchers losing spin, it was previously surmised batters weren't used to the new movement, so the drop in spin may not have been as detrimental.
The driving force for the spike in June homers was Mother Nature. The following was discovered after searching "average temperature June USA."
June Temperature. The average contiguous U.S. temperature during June was 72.6°F, 4.2°F above the 20th century average, ranking warmest in the 127-year record and surpassing the previous record set in 2016 by 0.9°F.
The lesson here is while spin affects performance, there are other factors exerting more of an impact.
As is always the case, each pitcher needs to be looked at individually. And to be honest, the ultimate conclusion, that how a pitcher's strikeout and home run rates recover in the spring will drive their chance of success, didn't require umpteen pretty colored graphs and a table of regressions.
That said, I'm a huge fan of data supporting intuition, so while I won't be submitting this for research article of the year, it's not a waste of time either.
As always, I'm happy to address questions in the comments. And I promise, nest week's piece will be more helpful in terms of 2022 fantasy drafts.