
Dave Wasserman has made a name for himself as a political analyst as the face of the Cook Political Report. You may not know of his name, but you certainly know his catchphrase, "I've seen enough," which he uses to make his final calls for races on Twitter once he has enough data to make a conclusive call sometimes well in advance of the networks calling the race. He did predict the 2016 Presidential Election two months before the actual event and if you're a political junkie, you likely have his tweets set up to ping you when he tweets on election night. I am by no means comparing myself to him, but as we wrap up the second weekend of regular season baseball, I am ready to make a prediction. I've seen enough; 2023 is going to look a lot more like 2019 than any other recent season. I make this decision based on recent work which shows that we don't need to get too deep into the schedule to get a gauge for the full season, as well as several recent data points.
Past Work
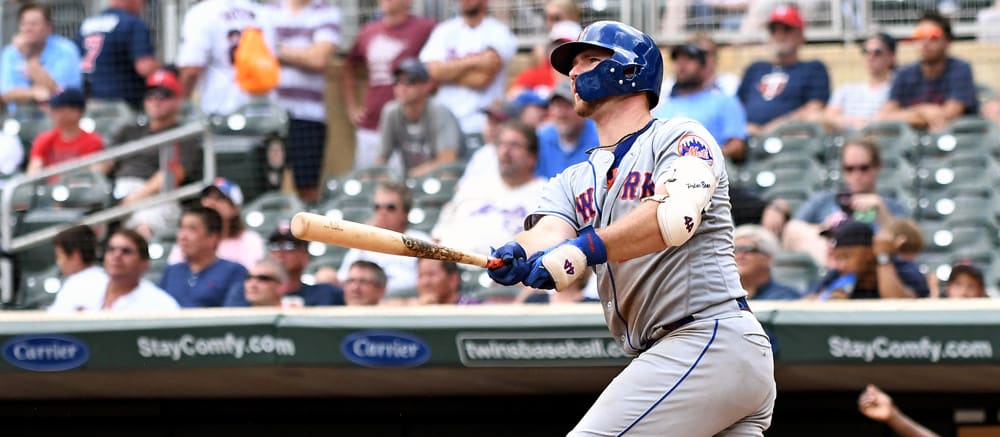
I wrote a similar article to this one both in 2021 and 2022 when we were 10 games into each season. The points raised in each article held up extremely well, as both seasons did indeed turn out as the early data points indicated with home runs and thus offense coming in below expectations. The early season HR/PA data for the first
Dave Wasserman has made a name for himself as a political analyst as the face of the Cook Political Report. You may not know of his name, but you certainly know his catchphrase, "I've seen enough," which he uses to make his final calls for races on Twitter once he has enough data to make a conclusive call sometimes well in advance of the networks calling the race. He did predict the 2016 Presidential Election two months before the actual event and if you're a political junkie, you likely have his tweets set up to ping you when he tweets on election night. I am by no means comparing myself to him, but as we wrap up the second weekend of regular season baseball, I am ready to make a prediction. I've seen enough; 2023 is going to look a lot more like 2019 than any other recent season. I make this decision based on recent work which shows that we don't need to get too deep into the schedule to get a gauge for the full season, as well as several recent data points.
Past Work
I wrote a similar article to this one both in 2021 and 2022 when we were 10 games into each season. The points raised in each article held up extremely well, as both seasons did indeed turn out as the early data points indicated with home runs and thus offense coming in below expectations. The early season HR/PA data for the first 10 games of the season hasn't strayed too far from the final figure for the season in recent seasons:
Season | Early HR/PA | Final HR/PA | Delta |
|---|---|---|---|
2016 | 36.2 | 32.9 | 10.0% |
2017 | 32.5 | 30.4 | 6.9% |
2018 | 36.1 | 33.1 | 9.1% |
2019 | 29.3 | 27.5 | 6.6% |
2020 | 30.2 | 28.9 | 4.5% |
2021 | 31.6 | 30.6 | 3.3% |
2022 | 36.9 | 34.9 | 5.7% |
2023 | 32.7 | ?? | ?? |
Going further back, the early HR/PA data point trends rather nicely with the final rate as the two have rarely strayed from one another:
2021 saw the first enforcement of sticky-stuff bans as well as the well-reported issue of inconsistencies between the baseballs being sent to various stadiums. Last season, maybe (using this loosely) the distribution of baseballs was better controlled and only Yankee Stadium got the bouncy balls (#tinfoilhat). Power was down from 2021m and the season began with a lot of low-scoring affairs as we all wondered where all the offense went. Fast forward to this season...
Where We Stand
The league introduced multiple variables into the regular season equation in 2023. This is just a list of things pitchers need to worry about while on the mound:
- They cannot have the defense behind them be aligned as strategically as they once were
- They must come set on the rubber by a certain time
- They must deliver a pitch to home by a certain time
- They can only disengage from the rubber a limited number of times
- They can only throw over to an occupied base a limited number of times
- There is a renewed focus on sticky stuff enforcement (and it is working)
- There is a renewed sense of aggressiveness with attempted stolen bases
- There is less time between pitches to recharge the body for the next violent effort
Am I missing anything? Pitchers have had more variables thrown against them this season, putting added stress on them while the only new stressors for hitters appear to be limited timeouts and the fact they must be looking at the pitcher ready to receive a pitch at a certain time. Otherwise, hitters are seeing more favorable defensive alignments and hitting with more runners in scoring position, which can often influence pitch selection, pitch command and pitch velocity with the pitcher working from the stretch. Needless to say, offense is up in a big way so far as we look back at the previous three March/Aprils:
Season | PA | HR | R | RBI | SB | CS | AVG | OBP | SLG | BABIP | BB% | K% |
2021 | 28409 | 875 | 3260 | 3074 | 354 | 104 | 0.232 | 0.309 | 0.390 | 0.283 | 8.8% | 24.4% |
2022 | 23461 | 574 | 2557 | 2423 | 303 | 109 | 0.231 | 0.307 | 0.369 | 0.282 | 8.9% | 23.0% |
2023 | 9562 | 302 | 1174 | 1122 | 167 | 41 | 0.250 | 0.326 | 0.413 | 0.299 | 9.3% | 22.5% |
The changes to the game have played a part to influence more offense, as batting average is up eight percent over 2022 while BABIP is up six percent. The crazy part of it all is that the BABIP improvement isn't coming from the source we would have imagined: line drives. Early on, the batted-ball outcomes for line drives over the past three seasons are rather similar, but the groundballs are have more eyes and are finding more holes. This article isn't about the liners or grounders, however. It's about the increase in homers and where we're very likely headed the rest of the way.
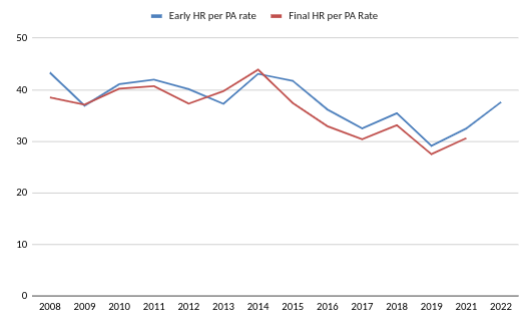
The average distance on flyballs overall is currently 313 feet, which is 2 feet further than the entirety of March/April 2022 but lower than any previous season. The average distance on straightway flyballs is also stagnant to date, as it's equal to last March/April, the lowest average distance in the dataset. However, we're seeing a change in pulled flyballs, and that's where things get very interesting:
The presence (or lack thereof) of the shift is not going to influence a hitter's desire to pull flyballs, but pull-side flyballs traveling further may. The league is currently hitting more pull-side flyballs this season than they have in previous seasons. The average exit velocity on pulled flyballs in 2023 is essentially identical to 2022 (95.6 mph vs. 95.7), so the league isn't hitting those types of batted balls any harder, just further. If we were indeed seeing the injection of a juiced ball again, we should see some sort of change in straightaway flyballs, yet those have remained flatlined from last season. The average pull-side flyball is already at 2021 levels and could very well surpass the 2018-2019 levels with three more weeks of baseball and warmer temperatures to come in April.
We know from a recently published study that, on average, a one-degree celsius increase in air temperature on game day correlates with nearly a two-percent uptick in the number of homers per game. The study also notes that each additional degree of global warming results in an additional 95 homers per season. The Farmer's Almanac warns us that the sizzles will return this summer, calling for a warmer than normal summer for most of the nation. Another site has a similar prediction this summer, with above-average temps in the outdoor parks of Philly, New York and Boston, venues that are already mostly favorable for hitters. BallPark Pal on Twitter also has some interesting data on the effect of temperature on baseballs, noting that balls travel 15-20 feet further in 80 degree weather than they do in 60 degree weather. This entire thread is worth the read.
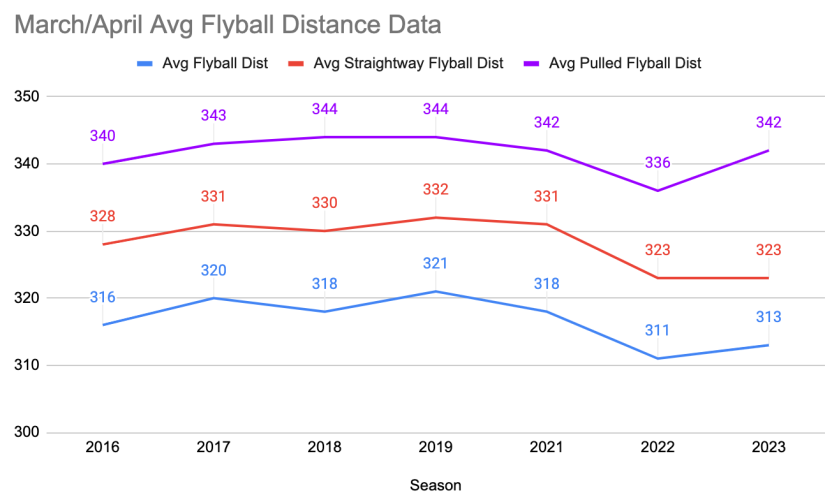
I mentioned in last week's article that we are seeing less drag on the baseball early on compared to what we saw in 2021 and 2022, but we're still nowhere near where things were in 2019. We're seeing that play out in the number of homers, as we're seeing a home run hit every 31.7 plate appearances so far this season. That's the second-highest frequency since 2016, trailing only the fun times of 2019:
I do not believe this is a baseball production issue as much as I do a confluence of factors creating the chaos. Alex Chase pointed out on Twitter over the weekend that the quality of contact has been absent from much of the discussion about the early power surge, so I included it in the chart below:
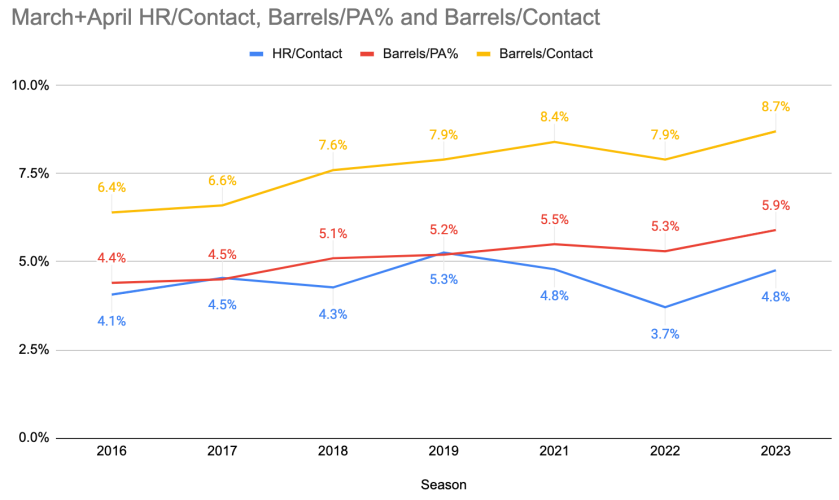
The homers per contact are already at 2021 levels and are trending toward 2019 levels, but note what we are seeing on the percentage of barrels by plate appearance as well as by overall contact. After years of pitchers coming into the season with newfound velocity, arm angles, release points and pitches, the hitters appear to be fighting back this season amidst the chaos of the new world order by making more quality contact than they ever have. Is some of that influenced by the quality of pitching currently on the injured list, as teams are replacing the likes of Carlos Rodon, Justin Verlander, Max Fried, Kyle Wright, Tyler Glasnow, Triston McKenzie, Tony Gonsolin, Jose Quintana, Robbie Ray and Joe Musgrove with lesser quality arms? That cannot be overlooked, because that's a high volume of good-to-great stuff missing from pitching mounds around the league. As those arms begin to trickle back into rotations, we should assume they will have some impact on normalizing the offensive explosion we've seen early on. However, there is only so much they are going to be able to control. Derek Carty weighed in over the weekend as well as he continues to watch the data daily for his work with The Bat projection system, and he added some other data points:
Home Runs are wayyyyyy ⬆️UP⬆️ this season... nearly to 2019 happy-fun-ball levels
Home Run per Contact% (weather-adjusted)
4.4% - 2018
5.4% - 2019
5.2% - 2020
4.9% - 2021
4.2% - 20224.7% - 2023 (unadjusted)
— Derek Carty (@DerekCarty) April 8, 2023
5.3% - 2023 (weather-adjusted)
5.0% - 2023 (regressed for sample size)
When I asked Derek where he would be if I set the over/under on 2023 homers at 6750, he said he would take the under but it would be close. Understand, even if the league finished at 6700 homers, that would represent a 28.5% increase over 2022!
The earlier point of how the decreased recovery time for pitchers should be considered as well. Corbin Young had some interesting data points over the weekend which show little impact at a macro level:
Looking at pitch tempo & it's a drastic difference between bases empty & runners on base. Even more so in 2023, meaning less rest between pitches.
Interestingly, the velocity on 4-seamers/sinkers hasn't varied much.
Less rest probably means changing how they pitch & train. pic.twitter.com/ni0hEYSo6O
— Corbin (@corbin_young21) April 8, 2023
However, we do not know the micro-level impacts of what these changes are doing to a pitcher's command or control. The velocity may still be there, but can they hit their spots as the duress compiles during an outing? The times through the order penalty is beginning to level out, as starting pitchers league-wide have allowed 72 homers both the first as well as the second time through a lineup. Those who stay in a third time have surrendered another 38 more. Here is what we are seeing so far by role:
SEASON | % of HRs by SP | % of HRs by RP |
2021 | 60% | 40% |
2022 | 59% | 41% |
2023 | 61% | 39% |
Simply put, we don't yet have a great way to measure how the changes to the game are impacting a pitcher's ability to consistently execute pitches and whether the changes are to blame for what we see so far. Even the best pitchers miss their intended target anywhere from 10 to 12 inches on a given pitch, so perhaps the extra stressors are pushing that baseline up and we're seeing more pull shots and more homers because pitchers are making more early mistakes than we're accustomed to seeing from these esteemed craftsmen.
Where Are We Headed?
I've seen enough to confidently state that we'll see more homers than we have seen in any season since 2019, with an outside chance of eclipsing the record set that season. The missing quality starting pitching will eventually return to rotations and raise the level of pitching which is impacting this early production, but they're only going to be able to stop so much momentum given that other pitching injuries are bound to happen. The weather will warm up week by week, and we don't yet know the long-term effects of how the changes to the pitching rules will impact the older arms at the major-league level. It was one thing to look at steals, because we had the minor-league data to tell us what could come from those conditions, but we are truly in unchartered territory when looking at the in-season effects of these rule changes on pitchers and how their bodies and especially arms react to a change in usage unlike anything most of them have ever been through in their professional careers.
The collective pool of starting pitchers had a 3.91 ERA and 1.25 WHIP while holding the league to a .239/.308/.384 triple-slash line by the end of April last season. The pool of starting pitching in 2023 has a 4.67 ERA and 1.38 WHIP and has allowed a .256/.328/.426 triple-slash line 10 days into the season. The league wanted more offense and it has it in spades, but the outcome of more homers is unexpected, as the intended result of the rule changes was more action on the field and a decrease in the three-true-outcome behaviors the sport had embraced in recent seasons.
The New World Order is here, brother, and as Hulk Hogan told us years ago, "Whether you like it or you don't, learn to love it, cause it's the best thing going today."