I set a goal for myself in 2020 to not use the internet while flying, and instead use that time to read and consume podcasts. I've held up my end of that bargain so far on flights to Syracuse, Boston, and Austin. I vacillate between business books and fantasy podcasts and material this time of year, while also listening to a lot of SiriusXM in the car. One prevalent theme I've heard and read is how liberally the 200 IP label is being thrown around on starting pitchers.
We view 200 IP pitchers as workhorses, and rightly so. That means they're answering the bell at least 30 times a season and working an average of about seven innings an outing. That view also does not reflect present day reality in this world where most managers pay credence to the times-through-the-order penalty and are quick to begin leveraging the "A-bullpen" when the game is going well.
This change in baseball has been mostly gradual if not more recently sudden. At the beginning of the last decade, 45 pitchers worked at least 200 innings in a single season. However, by the end of the decade, just a third of that number did so:
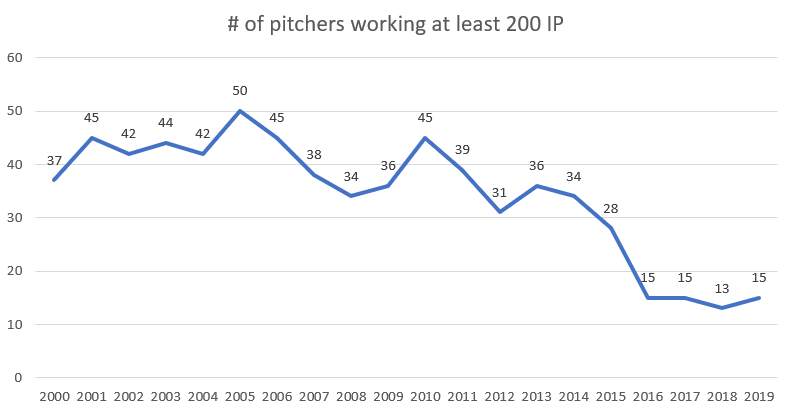
The final total each season has reached a new norm in past seasons, and it is roughly half of where things were just five seasons ago. This is why our RotoWire rankings only have 10 pitchers reaching 200 innings in 2020. Yes, there are 23 pitchers projected to work
I set a goal for myself in 2020 to not use the internet while flying, and instead use that time to read and consume podcasts. I've held up my end of that bargain so far on flights to Syracuse, Boston, and Austin. I vacillate between business books and fantasy podcasts and material this time of year, while also listening to a lot of SiriusXM in the car. One prevalent theme I've heard and read is how liberally the 200 IP label is being thrown around on starting pitchers.
We view 200 IP pitchers as workhorses, and rightly so. That means they're answering the bell at least 30 times a season and working an average of about seven innings an outing. That view also does not reflect present day reality in this world where most managers pay credence to the times-through-the-order penalty and are quick to begin leveraging the "A-bullpen" when the game is going well.
This change in baseball has been mostly gradual if not more recently sudden. At the beginning of the last decade, 45 pitchers worked at least 200 innings in a single season. However, by the end of the decade, just a third of that number did so:
The final total each season has reached a new norm in past seasons, and it is roughly half of where things were just five seasons ago. This is why our RotoWire rankings only have 10 pitchers reaching 200 innings in 2020. Yes, there are 23 pitchers projected to work at least 190 innings this season, but that is not unusual. Let's look at pitchers in 2014-2018 who worked 200 innings one season and then examine their workload the following season.
2014 to 2015:
| PITCHER | 2014 | 2015 | % CHANGE |
|---|---|---|---|
| Keuchel | 200 | 232 | 14% |
| Greinke | 202.1 | 222.2 | 9% |
| Hamels | 204.2 | 212.1 | 4% |
| Scherzer | 220.1 | 228.2 | 4% |
| Quintana | 200.1 | 206.1 | 3% |
| Bumgarner | 217.1 | 218.1 | 0% |
| Dickey | 215.2 | 214.1 | -1% |
| Buehrle | 202 | 198.2 | -2% |
| Samardzija | 219.2 | 214 | -3% |
| Colon | 202.1 | 194.2 | -4% |
| Miley | 201.1 | 193.2 | -4% |
| Gray | 219 | 208 | -5% |
| Kluber | 235.2 | 222 | -6% |
| Lester | 219.2 | 205 | -7% |
| Teheran | 221 | 200.2 | -10% |
| Leake | 214.1 | 192 | -12% |
| Shields | 227 | 202.1 | -12% |
| Price | 248.2 | 220.1 | -13% |
| Cueto | 243.2 | 212 | -15% |
| Lynn | 203.2 | 175.1 | -16% |
| Hernandez | 236 | 201.2 | -17% |
| Harang | 204.1 | 172.1 | -18% |
| Porcello | 204.2 | 172 | -19% |
| Kennedy | 201 | 168.1 | -19% |
| Tillman | 207.1 | 173 | -20% |
| Burnett | 213.2 | 164 | -30% |
| Weaver | 213.1 | 159 | -34% |
| Hughes | 209.2 | 155.1 | -35% |
| Guthrie | 202.2 | 148.1 | -36% |
| Verlander | 206 | 133.1 | -55% |
| Peavy | 202.2 | 124 | -63% |
| Strasburg | 215 | 127.1 | -69% |
| McCarthy | 200 | 109.2 | -82% |
| Wainwright | 227 | 28 | -711% |
2015-2016:
| PITCHER | 2015 | 2016 | % CHANGE |
|---|---|---|---|
| Sale | 208.2 | 226.2 | 8% |
| Price | 220.1 | 230 | 4% |
| Bumgarner | 218.1 | 226.2 | 4% |
| Cueto | 212 | 219.2 | 3% |
| Quintana | 206.1 | 208 | 1% |
| Scherzer | 228.2 | 228.1 | 0% |
| Lester | 205 | 202.2 | -1% |
| Kluber | 222 | 215 | -3% |
| Samardzija | 214 | 203.1 | -5% |
| Archer | 212 | 201.1 | -5% |
| Volquez | 200.1 | 189.1 | -6% |
| Hamels | 212.1 | 200.2 | -6% |
| Teheran | 200.2 | 188 | -7% |
| McHugh | 203.2 | 184.2 | -10% |
| Shields | 202.1 | 181.2 | -11% |
| Lackey | 218 | 188.1 | -16% |
| Arrieta | 229 | 197 | -16% |
| Dickey | 214.1 | 169.2 | -26% |
| Hernandez | 201.2 | 153.1 | -32% |
| Keuchel | 232 | 168 | -38% |
| Greinke | 222.2 | 158.2 | -40% |
| Kershaw | 232.2 | 149 | -56% |
| Lewis | 204.2 | 116.1 | -76% |
| Gray | 208 | 117 | -78% |
| Cole | 208 | 116 | -79% |
| Zimmermann | 201.2 | 105.1 | -91% |
| Miller | 205.1 | 101 | -103% |
| Richards | 207.1 | 34.2 | -498% |
2016-2017:
| PITCHER | 2016 | 2017 | % CHANGE |
|---|---|---|---|
| Samardzija | 203.1 | 207.2 | 2% |
| Archer | 201.1 | 201 | 0% |
| Stroman | 204 | 201 | -1% |
| Kluber | 215 | 203.2 | -5% |
| Sale | 226.2 | 214.1 | -5% |
| Porcello | 223 | 203.1 | -9% |
| Verlander | 227.2 | 206 | -10% |
| Quintana | 208 | 188.2 | -10% |
| Totals | 3725 | 3642.2 | -2% |
| Lester | 202.2 | 180.2 | -11% |
| Scherzer | 228.1 | 200.2 | -12% |
| Roark | 210 | 181.1 | -14% |
| Hamels | 200.2 | 148 | -26% |
| Cueto | 219.2 | 147.1 | -33% |
| Bumgarner | 226.2 | 111 | -51% |
| Price | 230 | 74.2 | -68% |
2017-2018:
| PITCHER | 2017 | 2018 | % CHANGE |
|---|---|---|---|
| Scherzer | 200.2 | 220.2 | 10% |
| deGrom | 201.1 | 217 | 8% |
| Kluber | 203.2 | 215 | 6% |
| Verlander | 206 | 214 | 4% |
| Greinke | 202.1 | 207.2 | 3% |
| Cole | 203 | 200.1 | -1% |
| Carrasco | 200 | 192 | -4% |
| Porcello | 203.1 | 191.1 | -6% |
| Gonzalez | 201 | 171 | -15% |
| Archer | 201 | 148.1 | -26% |
| Sale | 214.1 | 158 | -26% |
| Martinez | 205 | 118.2 | -42% |
| Stroman | 201 | 102.1 | -49% |
| Samardzija | 207.2 | 44.2 | -78% |
| Santana | 211.1 | 24.2 | -88% |
2018-2019:
| PITCHER | 2018 | 2019 | % CHANGE |
|---|---|---|---|
| Cole | 200.1 | 212.1 | 6% |
| Verlander | 214 | 223 | 4% |
| Corbin | 200 | 202 | 1% |
| Greinke | 207.2 | 208.2 | 0% |
| Nola | 212.1 | 202.1 | -5% |
| deGrom | 217 | 204 | -6% |
| Mikolas | 200.2 | 184 | -8% |
| Scherzer | 220.2 | 172.1 | -22% |
| Clevinger | 200 | 126 | -37% |
| Keuchel | 204.2 | 112.2 | -45% |
| Freeland | 202.1 | 104.1 | -48% |
| Kluber | 215 | 35.2 | -84% |
Not one pitcher — not Justin Verlander, Gerrit Cole or Zack Greinke — pitched 200 IP in all five seasons. Every pitcher has something go wrong in a timespan, which leads to them missing time.
The average workload reduction in each group from year one to year two has been 13 percent with a range from 11 to 16 percent:
| SPAN | AVG REDUCTION |
|---|---|
| 2014-2015 | -13% |
| 2015-2016 | -16% |
| 2016-2017 | -11% |
| 2017-2018 | -13% |
| 2018-2019 | -11% |
| Average | -13% |
By count, approximately 60 percent of pitchers have failed to pitch 200 innings in consecutive seasons the last few years, which brings us to 2020. Fifteen starting pitchers threw at least 200 innings in 2019. The recent research says we should expect nine of those 15 not to repeat their 2019 workloads. The table below shows those pitchers, their 2019 workload, and our 2020 projected innings for those pitchers:
| Player | 2019 IP | 2020 Proj | % Change |
|---|---|---|---|
| Justin Verlander | 223 | 215 | -4% |
| Shane Bieber | 214.1 | 204 | -5% |
| Trevor Bauer | 213 | 195 | -8% |
| Gerrit Cole | 212.1 | 208 | -2% |
| Stephen Strasburg | 209 | 192 | -8% |
| Zack Greinke | 208.2 | 206 | -1% |
| Lance Lynn | 208.1 | 187 | -10% |
| Mike Minor | 208.1 | 188 | -10% |
| Madison Bumgarner | 207.2 | 199 | -4% |
| Jacob deGrom | 204 | 206 | 1% |
| Eduardo Rodriguez | 203.1 | 175 | -14% |
| Marco Gonzales | 203 | 198 | -2% |
| Aaron Nola | 202.1 | 200 | -1% |
| Patrick Corbin | 202 | 198 | -2% |
| Jose Berrios | 200.1 | 198 | -1% |
| Totals | 3117.1 | 2969 | -5% |
The good news: 14 of the 15 pitchers are projected to work fewer innings in 2020. That is how projections should work; you should regress a little. The bad news: the total projected innings reduction if just half of what it has been the last five seasons, so we should look into reasons why some of these pitchers likely will fail to reach their projected innings total. I outlined my case for Eduardo Rodriguez last week, and Shane Bieber the week before that, so let us look at some other possible candidates.
Marco Gonzales is an obvious candidate given he has rarely pitched a full season. He showed little signs of burning out last year after the big workload jump from 2017 to 2018, but the non-contending Mariners needed Gonzales to soak up innings so the bullpen did not have to get 12-plus outs every game. They're still in that situation, but can Gonzales hold up over a full season again?
Stephen Strasburg had not thrown 200 innings in five seasons before doing so last year. If you add his 36.1 postseason innings, Strasburg worked 240.1 innings last season; a 110-inning jump from his 2019 effort. Given his track record of missing time in each season, we have to expect something creeps up again and prohibits him from making 30 starts.
Madison Bumgarner threw 200 innings for the Giants last season as the team was out of contention from day one and had a suspect bullpen. Arizona is the opposite this year, so Bumgarner could see a quicker hook. Then again, his bat is better than some pinch-hitting possibilities, which could keep him in the game a little longer than most.
Gabe Kapler left Aaron Nola out in games too long last season because that Philadelphia bullpen had issues, and Nola's 2018 season gave the skipper some false hope. Nola's ERA the third time through a lineup from 2016-2018 was 4.72, 5.32 and 2.35. Kapler exercised recency bias and saw Nola post a 6.75 ERA in 49.1 innings when going the third time through the order. New Phillies manager Joe Girardi loves his bullpens and will not make this same mistake.
It would not surprise me to see the 200 IP list increase a little in 2020 with the new three-batter rule in place, which will stop managers from going to a specialist right after pulling a starter. That said, the 200 IP label needs to be more conservatively doled out these days as 180 is the new 200.