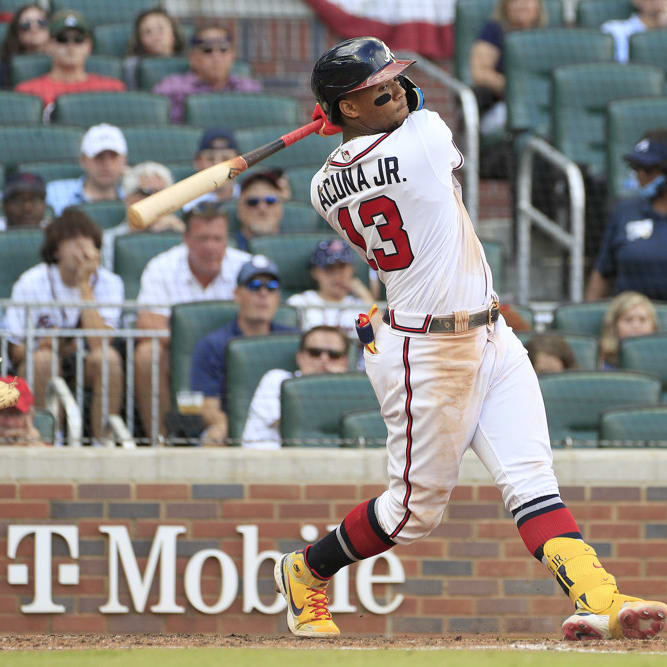
A few times a year, I like to switch away from the usual subjective look at my top risers and fallers and turn things over to the RotoWire Earned Auction Value Calculator. For as much as I want to avoid focusing on generally unpredictive results stats like wins or RBI in favor of looking at a player's underlying process and skills, it's wins and RBI that actually win fantasy leagues, so we don't want to lose site of them entirely.
In this article, I've compared each player's rank in earned value through the end of April to his average draft position in all RotoWire Online Championship drafts on NFBC. We'll go position group by position group, noting the players who have risen or fallen the most, though we'll begin with a group of risers from within the first 50 picks, as those moves are often the most significant even though it's hard to move too many spots within this range.
The boring technical bits: for the risers, I've ranked them by percent of possible spots gained (% Gain) rather than raw number of spots gained, because it's more impressive to jump from 50 to 5 than from 500 to 400. I've also excluded risers who remain outside the top-276, i.e. those who haven't been startable in a 12-team mixed league. Similarly, I've excluded fallers who began outside the top-276, as those guys were drafted with reserve-round picks and are easily cut. I've also excluded fallers whose falls come as
A few times a year, I like to switch away from the usual subjective look at my top risers and fallers and turn things over to the RotoWire Earned Auction Value Calculator. For as much as I want to avoid focusing on generally unpredictive results stats like wins or RBI in favor of looking at a player's underlying process and skills, it's wins and RBI that actually win fantasy leagues, so we don't want to lose site of them entirely.
In this article, I've compared each player's rank in earned value through the end of April to his average draft position in all RotoWire Online Championship drafts on NFBC. We'll go position group by position group, noting the players who have risen or fallen the most, though we'll begin with a group of risers from within the first 50 picks, as those moves are often the most significant even though it's hard to move too many spots within this range.
The boring technical bits: for the risers, I've ranked them by percent of possible spots gained (% Gain) rather than raw number of spots gained, because it's more impressive to jump from 50 to 5 than from 500 to 400. I've also excluded risers who remain outside the top-276, i.e. those who haven't been startable in a 12-team mixed league. Similarly, I've excluded fallers who began outside the top-276, as those guys were drafted with reserve-round picks and are easily cut. I've also excluded fallers whose falls come as a result of them missing more than a week due to injury, as it's not very useful for me to tell you that it's bad when your players get hurt.
Risers
| Top 50 Picks | Team | Pos | OC ADP Rank | Earned Value Rank | % Gain |
|---|---|---|---|---|---|
| Aaron Judge | NYY | OF | 3 | 1 | 100.0% |
| Pete Alonso | NYM | 1B | 42 | 8 | 82.9% |
| Oneil Cruz | PIT | SS/OF | 34 | 10 | 72.7% |
| Kyle Tucker | CHC | OF | 8 | 3 | 71.4% |
| Fernando Tatis | SD | OF | 11 | 5 | 60.0% |
 Oneil Cruz, SS/OF, Pirates: Cruz had shown enough promise over parts of four seasons that he was picked late in the third round of the RotoWire Online Championship, but drafters who selected him needed some growth beyond what he'd shown so far to justify the pick. The 6-foot-7 shortstop-turned-center-fielder was as physically impressive as they come and could light up a Statcast page, but his .259 average, 21 homers and 22 steals in 2024 were all a) not particularly notable and b) career highs.
So far, those who had faith in Cruz continuing to develop have been rewarded. He's hitting the ball even harder this year, with his hard-hit rate improving from 54.9 percent to 62.2 percent, but he didn't really need anything more in that area. Far more significant is his improvement in strikeout rate, which sits at 26.1 percent, well below the 31.6 percent mark he carried into the year. That's backed by a big improvement in chase rate, where he's down to 27.6 percent after averaging 33.2 percent through the end of last year. But most notable of all is the fact that Cruz has simply decided to run wild. He's always had good speed but hasn't run like he wanted to lead the league in steals. This year, it looks like he does, and so far, he's doing just that, swiping 14 bags.
| Catchers | Team | Pos | OC ADP Rank | Earned Value Rank | % Gain |
|---|---|---|---|---|---|
| Carson Kelly | CHC | C | 361 | 46 | 87.5% |
| Cal Raleigh | SEA | C | 81 | 32 | 61.3% |
| Hunter Goodman | COL | C/OF | 331 | 139 | 58.2% |
| Jose Trevino | CIN | C | 543 | 271 | 50.2% |
| Sean Murphy | ATL | C | 291 | 149 | 49.0% |
 Hunter Goodman, C/OF, Rockies: Goodman was one of the stories of the first week of the fantasy season. He hit the ground running with a five-game hitting streak (including a pair of homers), but even if his performance wasn't as notable, the mere fact that he was being deployed as a typical starting catcher rather than as someone who started twice a week at catcher and maybe once or twice in the corner outfield meant that fantasy players needed to reevaluate what they thought of him.
Goodman's initial hot streak has worn off, and he's hit just .244/.333/.367 since those initial five games ended. Still, he ended April as the sixth-ranked fantasy catcher. He sits sixth in plate appearances among catchers (just three PA behind Salvador Perez in third), and of course, none of the backstops ahead of him get to call Coors Field home. It doesn't take much to be a valuable fantasy asset given Goodman's position and park, and it looks like he'll continue to clear the bar. Crucially, he's cut his strikeout rate from 28.6 percent last year to 23.0 percent this year, and he's raised his hard-hit rate from 39.6 percent to 46.9 percent at the same time.
| Corner Infielders | Team | Pos | OC ADP Rank | Earned Value Rank | % Gain |
|---|---|---|---|---|---|
| Tyler Soderstrom | ATH | 1B | 276 | 17 | 94.2% |
| Spencer Torkelson | DET | 1B | 358 | 36 | 90.2% |
| Alex Bregman | BOS | 3B | 109 | 13 | 88.9% |
| Wilmer Flores | SF | 1B | 361 | 47 | 87.2% |
| Ben Rice | NYY | 1B | 388 | 51 | 87.1% |
 Alex Bregman, 3B, Red Sox: Bregman's move to Boston caused the team some problems in terms of figuring out who exactly would play where, but at least in terms of potential new home parks for the veteran third baseman, there could hardly have been a better fit. He spent his first nine seasons making the most of a unique, short left field in Houston, and now he was going to get the chance to repeat the feat in front of an even more unusual left field in Boston.
Those who bought into Bregman following the move could hardly be happier with the result. He finished April as the top fantasy third baseman and a fringe first-round value. Interestingly, he's actually seen his strikeout rate jump way up to 18.1 percent after averaging 12.5 percent over the past seven years (never rising above 14.4), but that appears to be part of a conscious choice to trade contact for power. His 48.6 percent hard-hit rate is easily the best mark of his career, well above his previous career high of 40.1 percent, and he's also leaning even more heavily into a pulled flyball approach. His 52.3 percent pull rate is a career high, while his 47.7 percent flyball rate is a tenth of a percent away from another career high.
| Middle Infielders | Team | Pos | OC ADP Rank | Earned Value Rank | % Gain |
|---|---|---|---|---|---|
| Jorge Polanco | SEA | 2B | 467 | 15 | 97.0% |
| Geraldo Perdomo | ARI | SS | 469 | 23 | 95.3% |
| Brice Turang | MIL | 2B | 142 | 14 | 90.8% |
| Tommy Edman | LAD | 2B/OF | 172 | 24 | 86.6% |
| Brendan Donovan | STL | 2B/OF | 262 | 50 | 81.2% |
 Geraldo Perdomo, SS, Diamondbacks: Part of Perdomo's jump in fantasy value may have been attributable to his move up to the second spot in the batting order while Ketel Marte was out with a hamstring injury, but he's improved in many different ways this season and should continue to provide more value than expected even from the No. 9 spot. Perdomo made good contact prior to this season, getting his strikeout rate down to 14.9 percent last year while batting .273, but that's about all he did. He'd never managaed a hard-hit rate above 30 percent and never hit more than six homers.
In his age-25 season, however, Perdomo is showing improvements across the board. He's added 1.6 mph to his average bat speed, which has helped him to a career-best 31.1 percent hard-hit rate. That's not a particularly good mark, but it's a lot better to be in the 16th percentile in that category like his is this year than in the fifth percentile like he was last year. That's helped him to five home runs, already one shy of his previous career high. Just as importantly, he's continued to cut his strikeout rate, which now sits at 11.0 percent, well below his 15.8 percent walk rate. Elite plate discipline combined with the ability to hit for below-average power, rather than almost zero power, should be a formula that continues to work for Perdomo.
| Outfielders | Team | Pos | OC ADP Rank | Earned Value Rank | % Gain |
|---|---|---|---|---|---|
| Aaron Judge | NYY | OF | 3 | 1 | 100.0% |
| Teoscar Hernandez | LAD | OF | 53 | 2 | 98.1% |
| Pete Crow-Armstrong | CHC | OF | 125 | 6 | 96.0% |
| Wilyer Abreu | BOS | OF | 340 | 21 | 94.1% |
| Tommy Edman | LAD | 2B/OF | 172 | 24 | 86.6% |
 Pete Crow-Armstrong, OF, Cubs: Crow-Armstrong was a divisive player during draft season, with his detractors seeing a Kevin Kiermaier-type player who was likely to have a long and successful career thanks to his elite glove but not a career which would provide much fantasy value. Through April, those detractors (a group I should probably consider myself a member of given that I ranked him 176) look pretty stupid, as Crow-Armstrong has played like a first-rounder.
The 23-year-old is making more contact, cutting his strikeout rate from 23.9 percent to 20.3 percent. He's also making better contact, raising his barrel rate from 7.4 percent to 14.0 percent. The result has been a .271/.307/.564 slash line with nine homers and 12 steals, making him the sort of power-speed outlier that roto players love. Among the six players who already have double-digit steals this season, the aforementioned Oneil Cruz is the only one with more than five homers. If there's any negative for Crow-Armstrong thus far, it's his 4.2 percent walk rate, which lines up with his 5.1 percent mark from last season. Once his hot start cools off, he'll have some weeks where he's not getting on base much, and he won't be able to run as often as a result.
| Starting Pitchers | Team | OC ADP Rank | Earned Value Rank | % Gain |
|---|---|---|---|---|
| Nick Pivetta | SD | 168 | 12 | 93.4% |
| Nathan Eovaldi | TEX | 202 | 18 | 91.5% |
| Hunter Brown | HOU | 106 | 11 | 90.5% |
| Tyler Mahle | TEX | 422 | 53 | 87.7% |
| JP Sears | ATH | 551 | 87 | 84.4% |
 Nick Pivetta, SP, Padres: Pivetta failed to finish with an ERA below 4.00 in any of his first four MLB seasons, but he'd shown promising underlying numbers at times, particularly over the last two years. He struck out 30 percent of opposing batters while walking just 7.3 percent over those two seasons, helping him to a 3.32 SIERA. Those numbers represented improvements on his 24.5 percent strikeout rate, 9.1 percent walk rate and 4.14 SIERA over his first six seasons, but the elevated ERAs persisited.
There was plenty of talk this offseason that Pivetta might finally have his long-awaited career year now that he gets to pitch in San Diego rather than Philadelphia or Boston, and the early returns suggest that the hype was correct. Pivetta's 29.3 percent strikeout rate and 6.0 percent walk rate through six starts aren't very different from his numbers from last year, but he's allowed just 0.5 HR/9, down from 1.7 HR/9, helping him to a 1.78 ERA and 0.82 WHIP. He's certainly had some help from a .226 BABIP, and he's not going to maintain a 4.8 percent HR/FB rate, but on the whole, Pivetta is pitching very well and finally has the results to show for it.
| Relief Pitchers | Team | OC ADP Rank | Earned Value Rank | % Gain |
|---|---|---|---|---|
| Emilio Pagan | CIN | 610 | 120 | 80.5% |
| Jose Alvarado | PHI | 433 | 98 | 77.6% |
| Tommy Kahnle | DET | 585 | 190 | 67.6% |
| Jeff Hoffman | TOR | 112 | 39 | 65.8% |
| Camilo Doval | SF | 382 | 132 | 65.6% |
 Emilio Pagan, Reds: Fantasy players almost universally misread the situation in the Reds' bullpen, and I can't say I blame us. There was correctly plenty of doubt surrounding Alexis Diaz, who was optioned Thursday after posting a 12.00 ERA and 3:5 K:BB in six innings, but most of the attention went to the wrong alternatives. Pagan was selected in just two of 234 RotoWire Online Championship drafts, behind Taylor Rogers (48), Scott Barlow (39), Graham Ashcraft (29) and Tony Santillan (18), and given that Pagan owned a 4.15 ERA over the last five seasons, it's hard to argue with that.
Pagan has upended expectations with an excellent start to the year, saving eight games while posting a 2.35 ERA and 0.52 WHIP in 15.1 innings. He's striking out 31.5 percent of opposing batters while walking just 5.6 percent. Surprisingly, the Reds bullpen is actually full of pitchers with strong ERAs at the moment, with Ashcraft (0.57), Rogers (1.64) and Santillan (1.69) all off to particularly strong starts, but Pagan has done nothing to lose the job and will seemingly remain in the ninth inning until he loses manager Terry Francona's trust. There is one red flag here, however: Pagan's 17.6 percent groundball rate. He's always been a flyball pitcher, but pushing toward the extreme in that area could lead to a homer problem in the near future, especially in Cincinnati.
Fallers
| Catchers | Team | Pos | OC ADP Rank | Earned Value Rank | Spots Dropped |
|---|---|---|---|---|---|
| Yainer Diaz | HOU | C | 60 | 470 | 410 |
| Gabriel Moreno | ARI | C | 182 | 511 | 329 |
| Salvador Perez | KC | C/1B | 69 | 325 | 256 |
| Adley Rutschman | BAL | C | 61 | 300 | 239 |
| Ryan Jeffers | MIN | C | 232 | 414 | 182 |
 Gabriel Moreno, C, Diamondbacks: Moreno was drafted as the 12th catcher off the board in the RotoWire Online Championship but has been just the 35th-best catcher thus far. He's tied for fourth among catchers with 15 runs scored, but that's where the positives end, as he has just five RBI, zero homers, zero steals and a .244/.326/.280 average. Even at catcher, a player can't afford to provide such little value in the majority of roto categories.
Unfortunately, this isn't all that new for the 25-year-old, who's now in his third full season. His best fantasy campaign saw him hit .284 in 2023, but that came with just seven home runs. (His six steals that year were good for a catcher but don't exactly qualify him as a burner.) He's consistently made plenty of contact, striking out 17.4 percent of the time this year and 16.9 percent of the time for his career. He also hits the ball fairly hard, with a career 41.3 percent hard-hit rate, but he has an allergy to pulling the ball in the air, doing so on just 3.0 percent of his batted balls this season, well below the MLB average of 16.6 percent. He's never going to hit for meaningful power if that continues, and a player whose value comes mostly through batting average will sometimes have months where he hits .244.
| Corner Infielders | Team | Pos | OC ADP Rank | Earned Value Rank | Spots Dropped |
|---|---|---|---|---|---|
| Max Muncy | LAD | 3B | 257 | 693 | 436 |
| Matt Shaw | CHC | 3B | 208 | 619 | 411 |
| Triston Casas | BOS | 1B | 121 | 501 | 380 |
| Luis Rengifo | LAA | 2B/3B | 162 | 522 | 360 |
| Alec Bohm | PHI | 1B/3B | 161 | 493 | 332 |
 Matt Shaw, 3B, Cubs: Shaw was a popular sleeper choice this spring after the Cubs dealt away Isaac Paredes in the Kyle Tucker trade and declined to bring in an obvious alternative at the hot corner. While that did indeed foreshadow the fact that he would be the team's Opening Day third baseman, it wasn't a guarantee of immediate success. Instead, he was sent down after hitting .172/.294/.241 with one homer and no steals in his first 18 games.
Shaw saw his strikeout rate jump to 26.5 percent, well above the 18.2 percent he posted in the minors last year, though he did at least pair that with a strong 14.7 percent walk rate. His biggest problem was a far too low 22.5 percent hard-hit rate. If he can't demonstrate enough power to scare opposing pitchers, he'll probably see his walk rate collapse as pitchers continue to pound the zone against him. It would be a surprise if his hard-hit rate remained quite that low, however, as his 21 homers in the minors last season demonstrate respectable power at a minimum. He's also looked good since being demoted, hitting .302/.455/.442 in 12 games, so there's reason to believe he'll return before soon and find success.
| Middle Infielders | Team | Pos | OC ADP Rank | Earned Value Rank | Spots Dropped |
|---|---|---|---|---|---|
| Jonathan India | KC | 2B | 235 | 651 | 416 |
| Marcus Semien | TEX | 2B | 98 | 478 | 380 |
| Luis Rengifo | LAA | 2B/3B | 162 | 522 | 360 |
| Colt Keith | DET | 2B | 264 | 603 | 339 |
| Gunnar Henderson | BAL | SS | 9 | 317 | 308 |
 Jonathan India, 2B, Royals: India left a very hitter-friendly park in Cincinnati over the offseason, but the opportunity to hit in front of Bobby Witt, Vinnie Pasquantino and Salvador Perez seemingly made up for it. There's still time for that to come true, but India has offered fantasy teams very little this season outside of his 12 runs scored. He's yet to hit a homer or steal a base, has just five RBI and is slashing .212/.328/.265.
It's not all bad, as India's 15.7 percent strikeout rate and 14.2 percent walk rate are both excellent marks, but a player can't provide much fantasy value through plate discipline alone. India has never hit the ball particularly hard, with a 35.9 percent career hard-hit rate and a 36.6 percent mark this year, and he's not particularly fast. He reached 637 plate appearances last year and still managed just 15 homers and 13 steals. If he was producing at the same rate this year, he'd only have three homers and three steals by now, so it's not as if he's all that far behind expectations. His lack of category juice, however, means that he's simply not going to help your team very much during periods when his BABIP lags, as it does right now (.258).
| Outfielders | Team | Pos | OC ADP Rank | Earned Value Rank | Spots Dropped |
|---|---|---|---|---|---|
| Lane Thomas | CLE | OF | 167 | 860 | 693 |
| Jake McCarthy | ARI | OF | 223 | 915 | 692 |
| Jurickson Profar | ATL | OF | 175 | 841 | 666 |
| Anthony Santander | TOR | OF | 85 | 440 | 355 |
| Nolan Jones | CLE | OF | 267 | 613 | 346 |
 Anthony Santander, OF, Blue Jays: Santander is barely over a month into the five-year, $92.5 million deal he signed over the winter, and the Blue Jays may already be regretting it. While he still has plenty of time to heat up, his .184/.270/.320 slash line is very far from expectations for a player who slashed .245/.312/.476 over the previous five years.
Santander's underlying numbers don't show any one particular, glaring red flag, but instead, he's taken small steps back in multiple areas. His strikeout rate is up slightly, going from 19.4 percent last year to 22.7 percent this year, while his hard-hit rate has slipped a bit from 41.4 percent to 40.4 percent. His barrel rate has fallen by a large amount (from 11.7 percent to 5.3 percent), but that seems less to do with a loss of hard contact and more to do with a 10-point drop in flyball rate, which is down to a (still high) 44.7 percent. Altogether, it's hard to find major cause for concern here, but don't be surprised if the 30-year-old slugger is on the downslope of his career and finishes with numbers that don't match what he did at his peak.
| Starting Pitchers | Team | OC ADP Rank | Earned Value Rank | Spots Dropped |
|---|---|---|---|---|
| Dylan Cease | SD | 46 | 811 | 765 |
| Aaron Nola | PHI | 91 | 751 | 660 |
| Yusei Kikuchi | LAA | 163 | 807 | 644 |
| Zac Gallen | ARI | 118 | 620 | 502 |
| Roki Sasaki | LAD | 97 | 583 | 486 |
 Dylan Cease, SP, Padres: Cease was the ninth starter off the board in draft season, but he's been one of the worst starters in the league thus far. His 39 strikeouts (tied for 24th in MLB) mean he's helping in at least one category, but he has just one win and has done plenty of damage to fantasy teams' ratios with his 5.61 ERA and 1.60 WHIP.
While it's easy to point to Cease's year-to-year inconsistency and say that anyone who drafted him is paying the price for forgetting about his 4.58 ERA and 1.42 WHIP in 2023, a look under the hood suggests that things aren't so bad. His 3.84 SIERA is worse than his 3.46 mark from last season, but it still beats his 4.10 SIERA from 2023. He hasn't lost velocity, but he is missing fewer bats, with his strikeout rate dropping from 29.4 percent to 25.3 percent and his whiff rate falling from 32.4 percent to 28.6 percent. That's cause for mild concern, as is the fact that his walk rate has crept back up from 8.5 percent to 9.7 percent, but nothing here looks massively out of line with Cease's career norms. If his .375 BABIP normalizes and nothing else changes, we're probably looking at a slightly disappointing year for Cease but not a particularly notable one.
| Relief Pitchers | Team | OC ADP Rank | Earned Value Rank | Spots Dropped |
|---|---|---|---|---|
| Devin Williams | NYY | 44 | 864 | 820 |
| Jordan Romano | PHI | 166 | 976 | 810 |
| David Bednar | PIT | 159 | 579 | 420 |
| Felix Bautista | BAL | 74 | 332 | 258 |
| A.J. Puk | ARI | 237 | 402 | 165 |
 Devin Williams, RP, Yankees: The Yankees thought they'd added one of the best closers in baseball when they acquired Williams from the Brewers in December. Instead, he pitched his way out of the ninth inning by the end of April and currently sits with an 8.18 ERA and 1.82 WHIP. It's hard to find reasons for optimism when looking below the surface, and the Yankees have a very capable deputy in the form of Luke Weaver (0.00 ERA, 0.53 WHIP), so it could be some time before Williams reclaims his job.
Williams owned a 39.4 percent strikeout rate in his six seasons in Milwaukee but owns just a 20.8 percent strikeout rate in New York, while his walk rate has jumped from an already high 12.0 percent to an untenable 15.1 percent. He's lost a tick of velocity on his fastball, but the more important pitch to pay attention to for him is his famous "Airbender" changeup. The pitch has graded at an outstanding 125 Stuff+ for his career but sits at just 101 this season. If his best weapon is now merely average, it's no surprise to see his numbers fall off a cliff. Williams does have three scoreless innings with a 3:1 K:BB since his demotion from the closer role, so the turnaround might already be happening, but until Weaver gives up a run, it might be hard for Williams to reclaim the job.


