Lesson learned: less sausage, more meat. Understanding how the sausage is made is certainly a worthwhile endeavor but there's only about eight weeks before drafts pick up in earnest, so there will be less bandwidth on theory and more on application.
This week's discussion will continue the notion of breaking average exit velocity (AEV) into components, with flyballs the focus. By means of reminder, here is the 2019 league average velocity component data:
| Batted Ball | mph |
| Overall | 89 |
| Flyball | 92 |
| Line Drive | 93.3 |
| Groundball | 86.3 |
Pitches travel with a downward trajectory. In order to transfer the most energy to a batted ball, the swing path should match the trajectory, hence an uppercut. This explains the difference between grounders and flies. Neither are centered, but the upward trajectory of the swing transfers more energy to anything lofted.
The bulk of today's discussion will revolve around a concept Mike Podhorzer from Fangraphs introduced several years ago. Home run rate correlates very well with average fly ball distance (FBD). So much so, in fact, an expected home run total can be determined for every hitter and compared to their actual performance. Just like comparing any stat estimator, outliers can be identified and evaluated.
Parsing out flyball homers and comparing HR/FB (home run per fly) to average FBD, the correlation coefficient is .77. Intuitively, flyball distance should correlate with AEV on flies. Launch angle matters, but there should be some relationship. Sure enough, the correlation coefficient is a strong .90. Flyball AEV correlates to
Lesson learned: less sausage, more meat. Understanding how the sausage is made is certainly a worthwhile endeavor but there's only about eight weeks before drafts pick up in earnest, so there will be less bandwidth on theory and more on application.
This week's discussion will continue the notion of breaking average exit velocity (AEV) into components, with flyballs the focus. By means of reminder, here is the 2019 league average velocity component data:
| Batted Ball | mph |
| Overall | 89 |
| Flyball | 92 |
| Line Drive | 93.3 |
| Groundball | 86.3 |
Pitches travel with a downward trajectory. In order to transfer the most energy to a batted ball, the swing path should match the trajectory, hence an uppercut. This explains the difference between grounders and flies. Neither are centered, but the upward trajectory of the swing transfers more energy to anything lofted.
The bulk of today's discussion will revolve around a concept Mike Podhorzer from Fangraphs introduced several years ago. Home run rate correlates very well with average fly ball distance (FBD). So much so, in fact, an expected home run total can be determined for every hitter and compared to their actual performance. Just like comparing any stat estimator, outliers can be identified and evaluated.
Parsing out flyball homers and comparing HR/FB (home run per fly) to average FBD, the correlation coefficient is .77. Intuitively, flyball distance should correlate with AEV on flies. Launch angle matters, but there should be some relationship. Sure enough, the correlation coefficient is a strong .90. Flyball AEV correlates to HR/FB at virtually the same level, .77. It's this final correlation, average flyball velocity to HR/FB that drives the rest of the discussion.
Before diving into some intriguing players, while a .77 correlation is solid, it's not perfect. A possible reason for the discrepancy could be park dimensions. As such, I adjusted the flyball home runs according to the player's home venue. The resulting correlation is unchanged. Following up on this is a worthwhile project, but… less sausage, more meat.
Let's start with something simple. Here are the top 20 batters in terms of AEV (minimum of 10 homers).
| Rank | Player | AEV | HR | FB DIST | #FB | HR/FB |
|---|---|---|---|---|---|---|
| 1 | Joey Gallo | 100.9 | 19 | 359 | 47 | 40.4% |
| 2 | Miguel Sano | 100 | 32 | 367 | 72 | 44.4% |
| 3 | Nelson Cruz | 99.9 | 36 | 359 | 81 | 44.4% |
| 4 | Franmil Reyes | 99 | 35 | 351 | 92 | 38.0% |
| 5 | Adam Duvall | 98.1 | 10 | 353 | 34 | 29.4% |
| 6 | Aaron Judge | 98 | 24 | 347 | 63 | 38.1% |
| 7 | Jorge Soler | 97.4 | 43 | 349 | 115 | 37.4% |
| 8 | Josh Donaldson | 97.1 | 32 | 341 | 93 | 34.4% |
| 9 | Bryce Harper | 97 | 30 | 340 | 114 | 26.3% |
| 10 | Pete Alonso | 96.8 | 45 | 350 | 118 | 38.1% |
| 11 | Eloy Jimenez | 96.8 | 29 | 348 | 79 | 36.7% |
| 12 | Matt Adams | 96.8 | 18 | 346 | 58 | 31.0% |
| 13 | Jorge Alfaro | 96.7 | 15 | 346 | 57 | 26.3% |
| 14 | Kyle Schwarber | 96.7 | 35 | 342 | 109 | 32.1% |
| 15 | Mitch Garver | 96.7 | 29 | 336 | 80 | 36.3% |
| 16 | Christian Yelich | 96.5 | 38 | 347 | 105 | 36.2% |
| 17 | C.J. Cron | 96.5 | 18 | 338 | 84 | 21.4% |
| 18 | Matt Olson | 96.5 | 33 | 337 | 105 | 31.4% |
| 19 | Brad Miller | 96.4 | 12 | 338 | 37 | 32.4% |
| 20 | Juan Soto | 96.3 | 31 | 340 | 112 | 27.7% |
Most of the names are expected, with a couple of surprises with the pair of catchers catching my eye, especially Alfaro. The Marlins backstop doesn't take advantage of one of the highest flyball AEV. His home park doesn't help, but remember the fence in right field will be closer this season and Alfaro is adept at going the other way. More importantly, Alfaro fanned 33 percent of the time last season. Further, his ground ball rate was 52.7 percent, far too high for someone able to drive flyballs with authority. Because Alfaro's cost of acquisition is so cheap, it's worth the speculation his contact improves and/or he learns to elevate the ball more. Of course, this assumes doing either doesn't take away from his flyball AEV.
Let's look at some outlying players via various comparisons to see how the delta affected their 2019 home run total, then decide how it influences 2020 expectations.
The following table displays the 20 biggest differences between flyball AEV and AEV on all batted balls.
| Rank | Player | AEV FB | AEV All | HR | FB DIST | #FB | HR/FB |
|---|---|---|---|---|---|---|---|
1 | Ronny Rodriguez | 95.1 | 87.3 | 13 | 339 | 54 | 24.1% |
2 | Matt Adams | 96.8 | 88.4 | 18 | 346 | 58 | 31.0% |
3 | Roberto Perez | 96 | 88.3 | 21 | 343 | 68 | 30.9% |
4 | Corey Dickerson | 94.1 | 87.1 | 11 | 333 | 39 | 28.2% |
5 | Aristides Aquino | 94.2 | 87.9 | 19 | 339 | 46 | 41.3% |
6 | Jose Altuve | 93.3 | 86.1 | 28 | 336 | 92 | 30.4% |
7 | Tim Beckham | 93.9 | 87.5 | 14 | 326 | 55 | 25.5% |
8 | Jonathan Schoop | 93.8 | 87.5 | 18 | 337 | 62 | 29.0% |
9 | Starling Marte | 93.7 | 87.4 | 21 | 334 | 89 | 23.6% |
10 | Willson Contreras | 94 | 88.3 | 21 | 338 | 64 | 32.8% |
11 | Jose Martinez | 94.3 | 88.6 | 10 | 341 | 42 | 23.8% |
12 | Carlos Correa | 95 | 89 | 17 | 343 | 54 | 31.5% |
13 | Harrison Bader | 92.9 | 86.6 | 11 | 332 | 62 | 17.7% |
14 | Mike Yastrzemski | 94.2 | 88.7 | 20 | 340 | 78 | 25.6% |
15 | Wil Myers | 94.7 | 88.9 | 13 | 328 | 56 | 23.2% |
16 | Rougned Odor | 95.9 | 89.4 | 25 | 343 | 100 | 25.0% |
17 | Maikel Franco | 94.7 | 89 | 16 | 328 | 72 | 22.2% |
18 | David Dahl | 93.6 | 88.2 | 14 | 347 | 63 | 22.2% |
19 | Paul DeJong | 92.8 | 87 | 26 | 333 | 123 | 21.1% |
20 | Robinson Chirinos | 92.5 | 86.2 | 16 | 326 | 66 | 24.2% |
Note, the overall AEV for these players is below league average, but their flyball AEV is above average. A casual look at overall AEV in a vacuum may point towards some of these guys having inflated, or lucky, home run totals. However, digging deeper reveals the power output is more deserved.
Let's look at some of the more interesting batters from this table. There isn't a one-size-fits-all approach to the analysis. Each player should be considered in context. All the data required to choose a player on your own and look under the hood is available via searching the Statcast portion of Baseball Savant. Please feel free to post other players in the comments and I'll be happy to put them under the microscope.
There's nothing especially fantasy relevant about Rodriguez, but he's a good example of someone with an extreme delta between component AEV.
Overall | 87.3 |
Flyball | 95.1 |
Line Drive | 92.1 |
Groundball | 82.3 |
The only takeaway is overall AEV may not tell the whole story. Before whipping out the luck card, it's worth looking at the component AEV.
Heading into the 2019 campaign, Perez blasted 21 homers in 963 career plate appearances. Last season, he crushed 24 long balls in 449 PA, what gives? His flyball AEV last season was 96 mph, compared to 91 mph in 2018 and 92.1 mph in 2017. This doesn't guarantee Perez will maintain the significant gains, but there's more to his power surge than luck.
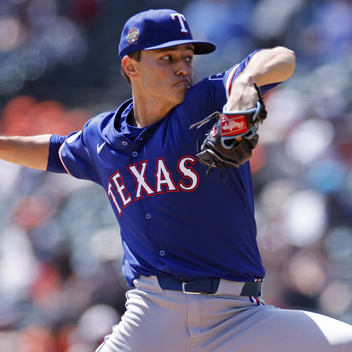
Odor's batting average is already a deterrent despite his knack for bullying up counting stats. With the Rangers moving into a new park that's assumed to be less hitter-friendly, there's even more of a reason to shy away. A league average AEV doesn't help his cause. However, Odor mashes flyballs with authority, which is reflected in his average flyball distance. If I already felt comfortable in batting average, I wouldn't hesitate to grab Odor, especially since his cost is essentially free.
Here's another list of perceived lucky players. The following is the 20 biggest discrepancies between their average FBD and HR/FB:
| Rank | Player | FB DIST | HR/FB | AEV FB |
|---|---|---|---|---|
1 | Brett Gardner | 315 | 27.5% | 90.6 |
2 | Jesse Winker | 320 | 27.3% | 91 |
3 | Will Smith | 326 | 30.4% | 93 |
4 | Pablo Sandoval | 319 | 25.6% | 92 |
5 | Derek Dietrich | 330 | 34.7% | 92.6 |
6 | Kurt Suzuki | 315 | 23.9% | 90.3 |
7 | Keston Hiura | 326 | 29.3% | 92.9 |
8 | A.J. Pollock | 317 | 24.2% | 92.5 |
9 | Matt Wieters | 322 | 26.2% | 91 |
10 | Tom Murphy | 329 | 31.6% | 94.4 |
11 | Yuli Gurriel | 318 | 24.1% | 90 |
12 | Anthony Rizzo | 325 | 27.5% | 93 |
13 | Clint Frazier | 320 | 24.5% | 91.3 |
14 | Gleyber Torres | 330 | 29.9% | 93.1 |
15 | Tucker Barnhart | 303 | 19.6% | 88.5 |
16 | Jake Marisnick | 317 | 22.7% | 92.1 |
17 | Mitch Haniger | 329 | 28.8% | 93.8 |
18 | Alex Bregman | 323 | 24.5% | 91.3 |
19 | Eugenio Suarez | 335 | 35.5% | 93 |
20 | Kris Bryant | 325 | 25.4% | 92.8 |
A lot of these differences are in part due to favorable venues. There are four Reds, three Astros and three Yankees, encompassing half the spots. It makes sense they're not all park related. If they were, the park factor adjustment would have resulted in a greater correlation.
Something to note with these players is not only are they subject to possible regression in HR/FB based on a short FBD, most of the distances are in the sweet spot with respect to benefiting from the reduced drag on last season's baseball. If the five to 10 feet of added travel is lost, they're all in danger of giving back a disproportionately large amount of their power gains from last season.
Looking at the other end of this spectrum should unearth perceived unlucky batters as the following HR/FB are low compared to the FBD.
| Rank | Player | FB DIST | HR/FB | AEV FB |
|---|---|---|---|---|
1 | Howie Kendrick | 342 | 20.9% | 94.8 |
2 | David Dahl | 347 | 22.2% | 93.6 |
3 | Alex Gordon | 329 | 9.0% | 91.8 |
4 | Brandon Dixon | 340 | 21.2% | 94.4 |
5 | Yadier Molina | 328 | 12.3% | 91.4 |
6 | Nick Castellanos | 334 | 18.4% | 94 |
7 | Brandon Drury | 335 | 19.0% | 92.3 |
8 | C.J. Cron | 338 | 21.4% | 96.5 |
9 | Tommy Pham | 338 | 21.4% | 94.9 |
10 | Harrison Bader | 332 | 17.7% | 92.9 |
11 | Evan Longoria | 333 | 18.5% | 93.9 |
12 | Danny Jansen | 332 | 17.8% | 91.8 |
13 | Charlie Blackmon | 341 | 23.3% | 92.7 |
14 | Yandy Diaz | 341 | 23.3% | 94.5 |
15 | Gio Urshela | 332 | 18.1% | 93.4 |
16 | Mookie Betts | 330 | 16.9% | 93.9 |
17 | Nick Ahmed | 330 | 17.3% | 91.2 |
18 | Jose Martinez | 341 | 23.8% | 94.3 |
19 | Jose Osuna | 333 | 20.0% | 92.6 |
20 | Eduardo Escobar | 329 | 17.3% | 91.3 |
Without a definitive reason for the deltas, there's a chance some of these players were indeed snake bit and are candidates to regress to the good. In addition, if they lose some distance, they're not as likely to have it cost them in terms of homers.
Castellanos is most interesting, seeing as though he's moving to a great power park. Urshela is also nice to see since the narrative is his power came out of nowhere, thus he could revert to previous levels when in fact, he should have hit even more homers last year.
Cron has spent a lot of his career in power-suppressing venues, so not only is it a plus Comerica Park is slightly favorable to righty swingers, he's due some positive HR/FB regression.
The final set of comparisons features flyball AEV and FBD. Remember, the correlation was .90 so the outliers can be telling. First, the longer than expected FBD:
| Rank | Player | FB DIST | AEV FB | HR/FB |
|---|---|---|---|---|
1 | Nolan Arenado | 339 | 92.1 | 26.5% |
2 | Charlie Blackmon | 341 | 92.7 | 23.3% |
3 | Trevor Story | 342 | 92.9 | 28.2% |
4 | Willie Calhoun | 335 | 91.8 | 29.8% |
5 | David Dahl | 347 | 93.6 | 22.2% |
6 | Ian Desmond | 339 | 92.8 | 24.7% |
7 | Brandon Drury | 335 | 92.3 | 19.0% |
8 | Danny Jansen | 332 | 91.8 | 17.8% |
9 | Nick Ahmed | 330 | 91.2 | 17.3% |
10 | Bryan Reynolds | 326 | 90.2 | 16.7% |
11 | Eduardo Escobar | 329 | 91.3 | 17.3% |
12 | Garrett Cooper | 340 | 93.6 | 30.4% |
13 | Jose Osuna | 333 | 92.6 | 20.0% |
14 | Jose Altuve | 336 | 93.3 | 30.4% |
15 | Alex Gordon | 329 | 91.8 | 9.0% |
16 | Hunter Pence | 338 | 93.5 | 32.0% |
17 | Yadier Molina | 328 | 91.4 | 12.3% |
18 | Eugenio Suarez | 335 | 93 | 35.5% |
19 | Chris Davis | 339 | 93.8 | 23.5% |
20 | Justin Upton | 332 | 92.6 | 29.7% |
It's no surprise five of the top six are Rockies, since the thin Denver air reduces resistance, lengthening flight. Another possible explanation is the backspin incurred when each batter hits a flyball. The science behind this goes beyond the scope of this discussion. However, something like backspin is a repeatable skill, it could explain a batter continually launching flyballs deeper than portended by the AEV. That said, perusing the non-Colorado players, no one has maintained a higher than expected homer total for consecutive seasons.
The last table shows the hitters with the shortest distances relative to their AEV:
| Rank | Player | FB DIST | AEV FB | HR/FB |
|---|---|---|---|---|
1 | Matt Chapman | 326 | 95 | 22.8% |
2 | Byron Buxton | 317 | 93.5 | 17.9% |
3 | Luke Voit | 326 | 94.6 | 24.4% |
4 | Ryan O'Hearn | 326 | 94.4 | 17.2% |
5 | Brandon Lowe | 331 | 95.8 | 27.6% |
6 | Marcell Ozuna | 332 | 96.2 | 24.2% |
7 | Maikel Franco | 328 | 94.7 | 22.2% |
8 | Wil Myers | 328 | 94.7 | 23.2% |
9 | Tim Beckham | 326 | 93.9 | 25.5% |
10 | A.J. Pollock | 317 | 92.5 | 24.2% |
11 | Kole Calhoun | 332 | 95.3 | 29.7% |
12 | Mitch Garver | 336 | 96.7 | 36.3% |
13 | Tom Murphy | 329 | 94.4 | 31.6% |
14 | Jackie Bradley Jr. | 329 | 94.2 | 22.6% |
15 | Yan Gomes | 315 | 92 | 15.7% |
16 | Edwin Encarnacion | 333 | 95.2 | 27.3% |
17 | Wilson Ramos | 328 | 93.9 | 21.4% |
18 | Yasiel Puig | 324 | 93.3 | 19.0% |
19 | Jake Marisnick | 317 | 92.1 | 22.7% |
20 | Jose Abreu | 335 | 95.6 | 28.8% |
Non-ideal backspin could be again be a cause for these results as can atmospheric conditions. If cold weather, or wind, or the marine layer were a tangible reason, though, more players from the associated teams would populate this list. Ergo, if it's random, the above are all candidates to improve in the long ball department next season.
The beauty of studies of this nature is the data is open to individual interpretation. With that in mind, here's a list of players I'm noting as possible power gainers this season, followed by some I'm worried could fall back.
Gainers
Fallers
Thus concludes a look at the relationship between fly ball average exit velocity and power. To reiterate, please post players you'd like examined closer, even if they don't appear on any of these lists.