We spend all winter working our draft allocation plans out, whether it be for straight drafts or auction formats. We know the 80th percentile targets, we know how much we wish to budget on hitting and pitching in auction, and we either calculate our own dollar values using the tried and true work of Art McGee who wrote a book on it in the 1990s, or we punch in our league settings into the RotoWire Custom Auction Values Calculator. Most rarely stray from those dollar values, or at least they try to avoid straying from them. I have sat in many auctions with representatives from sites who publish values and watched them stay within $2 of many of those published values. Most fantasy managers can account or plan for every dollar they spend in an auction and why they spent it. We also would readily recognize that such a level of preciseness cannot possibly predict the final outcomes of a season, as we watch end-gamer Josh Lowe out-earn first round lock Julio Rodriguez so far this season.
All that budget austerity goes out the window the moment FAAB season begins. Players have a hot week or even hot weekend and the big dollars start to fly. Here are just a few examples collected from this season alone:
- Taj Bradley $557
- Bryce Miller $404
- Vaughn Grissom $389
- Michael King $275
- Jorge Polanco $233
- Mike Clevinger $183
- Chas McCormick $177
- Martin Maldonado $175 — on an unopposed bid!
The good news
We spend all winter working our draft allocation plans out, whether it be for straight drafts or auction formats. We know the 80th percentile targets, we know how much we wish to budget on hitting and pitching in auction, and we either calculate our own dollar values using the tried and true work of Art McGee who wrote a book on it in the 1990s, or we punch in our league settings into the RotoWire Custom Auction Values Calculator. Most rarely stray from those dollar values, or at least they try to avoid straying from them. I have sat in many auctions with representatives from sites who publish values and watched them stay within $2 of many of those published values. Most fantasy managers can account or plan for every dollar they spend in an auction and why they spent it. We also would readily recognize that such a level of preciseness cannot possibly predict the final outcomes of a season, as we watch end-gamer Josh Lowe out-earn first round lock Julio Rodriguez so far this season.
All that budget austerity goes out the window the moment FAAB season begins. Players have a hot week or even hot weekend and the big dollars start to fly. Here are just a few examples collected from this season alone:
- Taj Bradley $557
- Bryce Miller $404
- Vaughn Grissom $389
- Michael King $275
- Jorge Polanco $233
- Mike Clevinger $183
- Chas McCormick $177
- Martin Maldonado $175 — on an unopposed bid!
The good news is one fantasy player may have come up with a way to help us all out and perhaps make our FAAB stretch a little longer by making us more aware of league FAAB spending habits as well as our own personal FAAB spending habits. Meet my friend Rob McCabe (@sleehratnation for those of you on Twitter.) He is also a RotoWire subscriber, so you will see him active in the comments in this article if you have questions for him on his process should I not sufficiently explain things for you.
Rob is the commissioner for two of my home leagues; a very long-standing AL-only league which dates back 30+ years as well as a newly formed 15-team mixed league with non-traditional scoring. By day, his job requires him to review high volumes of data and tell a story to his audience based on the data, which makes fantasy baseball a natural passion for someone who can manipulate spreadsheets as easily as Tony Gwynn twirled a bat during his career.
As our commissioner in two leagues, Rob goes the extra mile and sends out a weekly report with his thoughts on the league's weekly statistics as well as his thoughts on the FAAB activity which runs on Saturday nights in our league. He began these efforts as a way of improving as a fantasy manager after a moment of self-reflection a few seasons back that he was not very successful with his FAAB bids, as he either underbid on players or overcorrected by overbidding later in the process. Most recently, he had the idea of increasing the volume of the data he was reviewing to see how the behavior in our two leagues lined up with the behavior of NFBC leagues. He was mainly interested to see if the average Joe was more efficient in FAAB activity than participants in leagues with bigger stages. In his pursuit of this knowledge, McCabe has developed something he has labeled FE%: FAAB Efficiency
What is FE%?
McCabe describes the purpose of FE% as a way to evaluate how efficiently fantasy players are using their FAAB money. FE% evaluates how effective a bid was versus the rest of the league, without spending anymore than absolutely necessary. The higher the efficiency, the more an owner can get out of their FAAB budget over the course of a season.
What Does FE% Do?
The metric evaluates the winning bid against the runner-up bid and calculates the ideal bid based on the bids of the league. The metric can be applied to an individual team or at the league level. It does not take into consideration the actual quality of the bid, nor does it account for the player's eventual statistics, since you could easily accrue several players in an efficient manner who end up contributing little to nothing to your roster. Simply put, the higher the efficiency ratio, the better.
An Example of FE% In Action
A fantasy manager successfully bids on six players for $400, but the second-highest bids totaled $255. The ideal bids should have been $261, resulting in FAAB Efficiency of 65%. In addition, the average excess bid was $23, or median excess bid of $12.
Winning Bid | Runner Up Bid | Ideal Bid | FE% | Avg Excess Bid | Median Excess Bid |
|---|---|---|---|---|---|
$187 | $100 | $101 | 54% | $86 | $86 |
$95 | $90 | $91 | 96% | $4 | $4 |
$65 | $45 | $46 | 71% | $19 | $19 |
$35 | $10 | $11 | 31% | $24 | $24 |
$14 | $10 | $11 | 79% | $3 | $3 |
$4 | $0 | $1 | 25% | $3 | $3 |
$400 | $255 | $261 | 65% | $23 | $12 |
Calculating FE% requires a few data points and some Excel skills, unless Rob publishes his template for this (which he is working on.) One simply needs to pull the winning bid and runner up bid from the league transaction report and remove any contingent bids which are not needed. This is available in CBS Sportsline as long as the settings to publish such data are enabled in the admin controls, as it will publish both bids as well as identify contingent bids no longer needed. The NFBC data was even more usable for McCabe in his exercises, so I selfishly asked him to look at my two FAAB leagues.
How Efficient Am I?
McCabe gave me a handy report showing both how each league was doing as a whole as well as the individual performances of each owner. I'm protecting the names of the innocent in the graphs, but this is what each report looked like. My TGFBI league, as a whole, has been up and down with its efficiency:
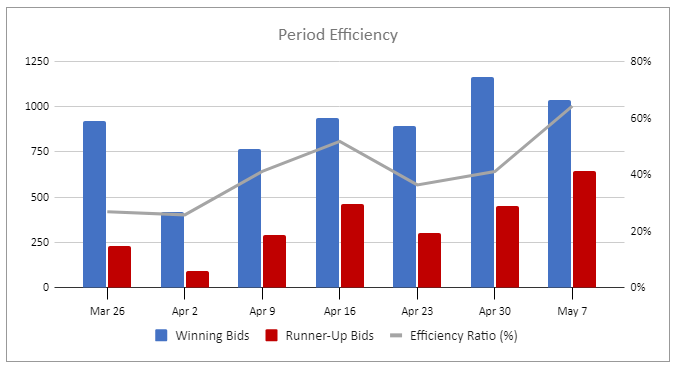
PERIOD | # Players | Winning Bids | Runner-Up Bids | Excess Spend | Optimal Bids | Efficiency Ratio | Avg Bid | Avg Overbid |
|---|---|---|---|---|---|---|---|---|
26-Mar | 19 | $921 | $229 | $674 | $248 | 27% | $48 | $35 |
2-Apr | 17 | $416 | $90 | $309 | $107 | 26% | $24 | $18 |
9-Apr | 25 | $766 | $290 | $451 | $315 | 41% | $31 | $18 |
16-Apr | 31 | $940 | $460 | $454 | $491 | 52% | $30 | $15 |
23-Apr | 26 | $895 | $299 | $570 | $325 | 36% | $34 | $22 |
30-Apr | 25 | $1,165 | $453 | $687 | $478 | 41% | $47 | $27 |
7-May | 22 | $1,034 | $642 | $370 | $664 | 64% | $47 | $17 |
Grand Total | 165 | $6,137 | $2,463 | $3,515 | $2,628 | 43% | $37 | $21 |
Teams | # Players | Winning Bids | Runner-Up Bids | Excess Spend | Optimal Bids | Efficiency Ratio | Avg Bid | Avg Overbid |
|---|---|---|---|---|---|---|---|---|
redacted1 | 14 | $99 | $65 | $21 | $79 | 79% | $7 | $2 |
redacted2 | 11 | $646 | $425 | $212 | $436 | 67% | $59 | $19 |
Collette | 16 | $350 | $201 | $133 | $217 | 62% | $22 | $8 |
redacted3 | 14 | $588 | $338 | $237 | $352 | 60% | $42 | $17 |
redacted4 | 14 | $376 | $160 | $203 | $174 | 46% | $27 | $15 |
redacted5 | 17 | $810 | $311 | $482 | $328 | 40% | $48 | $28 |
redacted6 | 7 | $651 | $250 | $394 | $257 | 39% | $93 | $56 |
redacted7 | 17 | $272 | $89 | $166 | $106 | 39% | $16 | $10 |
redacted8 | 16 | $205 | $60 | $129 | $76 | 37% | $13 | $8 |
redacted9 | 10 | $524 | $175 | $339 | $185 | 35% | $52 | $34 |
redacted10 | 6 | $255 | $83 | $166 | $89 | 35% | $43 | $28 |
redacted11 | 5 | $328 | $85 | $238 | $90 | 27% | $66 | $48 |
redacted12 | 13 | $795 | $205 | $578 | $218 | 27% | $61 | $44 |
redacted13 | 5 | $238 | $16 | $217 | $21 | 9% | $48 | $43 |
You may note there are only 14 teams on that table in a 15-team league. One team has yet to win any bid this season and is still in fifth place! My score is helped by the fact most of my bids have been lower in nature save one, but this is how my bids have gone in that league (we will come back to some specific data points shortly):
Add | Drop | Bid | Runner-Up | Gap | Excess Spend | Optimal Bid |
|---|---|---|---|---|---|---|
$246 | $181 | $65 | $64 | $182 | ||
$16 | $0 | $16 | $15 | $1 | ||
$15 | $0 | $15 | $14 | $1 | ||
$13 | $8 | $5 | $4 | $9 | ||
$12 | $0 | $12 | $1 | $1 | ||
$8 | $7 | $1 | $0 | $8 | ||
$7 | $0 | $7 | $6 | $1 | ||
$6 | $3 | $3 | $2 | $4 | ||
$6 | $0 | $6 | $5 | $1 | ||
$5 | $2 | $3 | $2 | $3 | ||
$5 | $0 | $5 | $4 | $1 | ||
$3 | $0 | $3 | $2 | $1 | ||
$2 | $0 | $2 | $1 | $1 | ||
$2 | $0 | $2 | $1 | $1 | ||
$2 | $0 | $2 | $1 | $1 | ||
$2 | $0 | $2 | $1 | $1 |
The results in the 12-team RotoWire Online Championship format is a bit different, both for myself and the league as a whole:
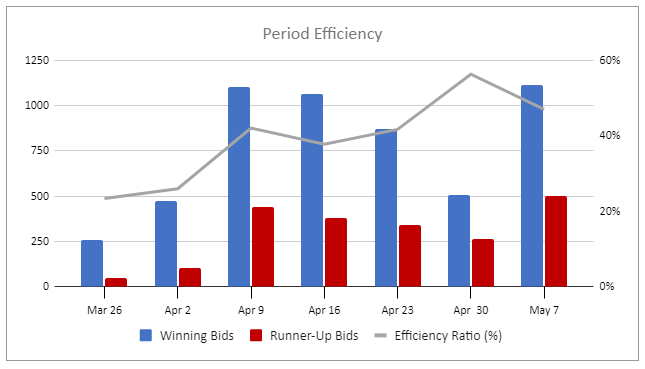
PERIOD | # Players | Winning Bids | Runner-Up Bids | Excess Spend | Optimal Bids | Efficiency Ratio | Avg Bid | Avg Overbid |
|---|---|---|---|---|---|---|---|---|
Apr 30 | 21 | $506 | $264 | $ 221 | $285 | 56% | $24 | $11 |
Apr 16 | 24 | $1,065 | $378 | $ 663 | $402 | 38% | $44 | $28 |
Apr 2 | 18 | $474 | $105 | $ 351 | $123 | 26% | $26 | $20 |
Apr 23 | 24 | $873 | $340 | $ 509 | $364 | 42% | $36 | $21 |
Apr 9 | 26 | $1,104 | $438 | $ 640 | $464 | 42% | $42 | $25 |
Mar 26 | 11 | $257 | $49 | $ 197 | $60 | 23% | $23 | $18 |
May 7 | 24 | $1,113 | $499 | $ 590 | $523 | 47% | $46 | $25 |
Grand Total | 148 | $5,392 | $2,073 | $ 3,171 | $2221 | 41% | $36 | $21 |
Teams | # Players | Winning Bids | Runner-Up Bids | Excess Spend | Optimal Bids | Efficiency Ratio | Avg Bid | Avg Overbid |
|---|---|---|---|---|---|---|---|---|
redacted1 | 12 | $331 | $194 | $125 | $206 | 62% | $28 | $10 |
redacted2 | 7 | $363 | $215 | $141 | $222 | 61% | $52 | $20 |
redacted3 | 16 | $686 | $395 | $275 | $411 | 60% | $43 | $17 |
redacted4 | 10 | $382 | $194 | $178 | $204 | 53% | $38 | $18 |
redacted5 | 17 | $531 | $237 | $277 | $254 | 48% | $31 | $16 |
Collette | 13 | $516 | $209 | $294 | $222 | 43% | $40 | $23 |
redacted6 | 17 | $379 | $117 | $245 | $134 | 35% | $22 | $14 |
redacted7 | 14 | $335 | $97 | $224 | $111 | 33% | $24 | $16 |
redacted8 | 8 | $400 | $115 | $277 | $123 | 31% | $50 | $35 |
redacted9 | 9 | $944 | $232 | $703 | $241 | 26% | $105 | $78 |
redacted10 | 10 | $236 | $40 | $186 | $50 | 21% | $24 | $19 |
redacted11 | 15 | $289 | $28 | $246 | $43 | 15% | $19 | $16 |
The killer for me in this league is that each player I've won in FAAB has been won between $3-$11 and none of them have had anyone else bid on them. I was shut out completely last week, losing out on Bryce Miller, Randal Grichuk and even Rich Hill. I am in third place in TGFBI and eighth place in my Rotowire OC, and my weaker performance in FAAB certainly has something to do with it although the rash of injuries the latter team has suffered already this season certainly has not helped. On the plus side, I have an above average FE% in both leagues, so I have that going for me, which is nice. Thanks, Lama.
I know what you're likely saying at this point: nobody cares about your fantasy teams. Perhaps you care about how the Main Event Leagues are doing?
FE% in Main Event Leagues
As I stated earlier, McCabe found the NFBC data trove to be incredibly helpful for this exercise, which made it easy for him to scrape out the data for all 53 Main Event Leagues. The charts and tables below show how these leagues are doing as a whole:
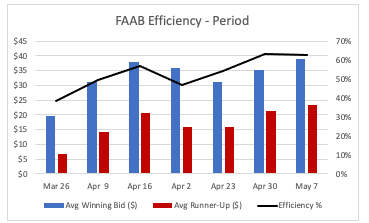
Period | # Winning Bids | Avg Bids ($) | Avg Runner-Up Bid ($) | Efficiency % |
|---|---|---|---|---|
Mar 26 | 341 | $20 | $7 | 39% |
Apr 9 | 1,793 | $31 | $14 | 49% |
Apr 16 | 1,822 | $38 | $21 | 57% |
Apr 2 | 1,410 | $36 | $16 | 47% |
Apr 23 | 1,725 | $31 | $16 | 54% |
Apr 30 | 1,748 | $35 | $21 | 63% |
May 7 | 1,902 | $39 | $23 | 63% |
Grand Total | 10,741 | $35 | $18 | 56% |
A picture is worth a thousand words, so I will just leave this here:
l
Simply put, every player has room for FAAB efficiency improvement. The team currently leading in the Main Event Overall standings has a FE% slightly above league average while the team with the best FE% so far this season is just inside the top 150 overall in the standings. There is one particular soft spot in the aggregate where FE% comes out lowest, which brings us back to my aforementioned issues in my Rotowire OC FE%:
Bid Group | # Players | Avg Bids ($) | Avg Runner-Up ($) | Avg Overbid ($) | Efficiency % |
|---|---|---|---|---|---|
$1-5 | 2,436 | $3 | $0 | $1 | 48% |
$6-20 | 3,568 | $12 | $3 | $8 | 36% |
$21-50 | 2,830 | $32 | $14 | $17 | 48% |
$51-100 | 1,152 | $69 | $37 | $31 | 55% |
$101-200 | 437 | $141 | $84 | $56 | 60% |
>$200 | 318 | $285 | $205 | $79 | 72% |
The area of least efficiency is the $6-$20 group. In a $1,000 budget, that may seem small, but these things add up over time, much like overspending in an auction where you go over your cheatsheet amount by $1 or $2 a few too many times and then spend the endgame wishing out loud you had more money and lamenting getting to dollar days quicker than expected. Some of this may just have to do with teams looking at a particular cheap two-start pitcher or wanting to ensure they fill a positional need as I did in my OC with Dean Kremer two weeks ago and then shortly after that with Michael Wacha. The $5 on Wacha was not terrible, but the $11 uncontested bid on Kremer could be one I look back on at regret later in the season as my FAAB money begins to dry up. I am also still trying to recover from the uncontested damage that rostering both Kyle Bradish and Graham Ashcraft has done to my ratios lately.
In summary, we all have room for improvement in our FAAB activities. The margin for error is much larger earlier in the season when everyone has money, and FE% should improve over time with less money to use in weekly FAAB activities. Take some time this weekend to see if you can pull this data for your own league to see how you are doing and where you can perhaps make your FAAB dollars stretch a little further this season with better efficiency. Thanks to Rob McCabe for taking the time to share his work with us, and hopefully readers can benefit from his work as I hope to do moving forward.