Much has been made of the issues with closers in this unsettled winter market, but I fear we are neglecting to give proper attention to the other elephant in the room: the changing wins market. Few measures in baseball have a steady linear trajectory, yet the percentage of wins between starters and relievers is pretty much there in recent years:

This past season saw starting pitchers garner 18% fewer wins as a group than they did as recently as 2017. An immediate thought which comes to mind is this is the influence of many teams shifting to an opener/bulk model approach made popular by Tampa Bay back in 2018 when injuries wrecked both their MLB and Triple-A rotations in the same month, but that influence is not as strong as one may believe. If we look at wins being assigned to relievers who face 10 or more batters in a single relief appearance, the numbers play out as such over the same span of years:
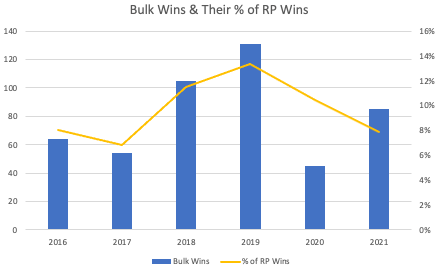
The shortened season of 2020 exacerbated the problem as we nearly saw relievers earn more wins than starters, but this is clearly a trend across baseball. The factors driving it range anywhere from teams trying to be cheap and control arbitration numbers which are driven by baseball card stats such as wins to clubs looking at the numbers and respecting the times through the order penalty. Somewhere in between is the simple fact teams are trying to keep their pitchers healthy.
If wins continue to
Much has been made of the issues with closers in this unsettled winter market, but I fear we are neglecting to give proper attention to the other elephant in the room: the changing wins market. Few measures in baseball have a steady linear trajectory, yet the percentage of wins between starters and relievers is pretty much there in recent years:
This past season saw starting pitchers garner 18% fewer wins as a group than they did as recently as 2017. An immediate thought which comes to mind is this is the influence of many teams shifting to an opener/bulk model approach made popular by Tampa Bay back in 2018 when injuries wrecked both their MLB and Triple-A rotations in the same month, but that influence is not as strong as one may believe. If we look at wins being assigned to relievers who face 10 or more batters in a single relief appearance, the numbers play out as such over the same span of years:
The shortened season of 2020 exacerbated the problem as we nearly saw relievers earn more wins than starters, but this is clearly a trend across baseball. The factors driving it range anywhere from teams trying to be cheap and control arbitration numbers which are driven by baseball card stats such as wins to clubs looking at the numbers and respecting the times through the order penalty. Somewhere in between is the simple fact teams are trying to keep their pitchers healthy.
If wins continue to be distributed as such, it behooves us to strategize our approach on how to best target conditions by which pitchers come across wins. We cannot look at this by reviewing pitchers as a whole, so I will separate the approach by looking at starters and relievers. I am also focusing on conditions which are mostly out of the pitcher's control.
Beneficial conditions for Starting Pitching Wins
Slow Managerial Hook - a.k.a. Billy Martin Syndrome
Let us take a stroll back to the 1980 baseball season when Billy Martin was the skipper of his hometown Oakland Athletics. Martin quickly identified that his starting pitchers would make or break the club because the bullpen was threadbare, so Martin would often roll his starting pitcher out there and wait for an umpire to screw up before leaving the bench to get into an argument.
Name | W | L | ERA | GS | CG | ShO | SV | IP | TBF |
Mike Norris | 22 | 9 | 2.53 | 33 | 24 | 1 | 0 | 284.1 | 1135 |
Matt Keough | 16 | 13 | 2.81 | 32 | 20 | 2 | 0 | 246.1 | 1021 |
Rick Langford | 18 | 12 | 3.29 | 33 | 28 | 2 | 0 | 287.2 | 1159 |
Steve McCatty | 14 | 13 | 3.8 | 31 | 11 | 1 | 0 | 220.1 | 951 |
Brian Kingman | 8 | 19 | 3.87 | 30 | 10 | 1 | 0 | 204.2 | 880 |
That quintet of starters faced 84% of the opposing batters and pitched 83% of the innings the club had that season. Their 94 complete games nearly lapped the next team, Milwaukee, which had 48 complete games on the season. The strike obviously disrupted the following season, but most of those arms were off the mound within two seasons of Martin's abuse. No manager has that slow of a hook, but I had to take the chance to revisit one of the more unique starting pitching seasons in baseball memory that does not get enough attention.
Today, we essentially have the exact opposite situation where most managers hope the starter can get them somewhere around 100 pitches before handing it off to an eight-man bullpen. The table below shows how each team has managed its pitching workload, showing the percentage of outings where the starting pitcher threw at least 80 pitches in a contest this past season:
Team | GS | 80-99 | 100-119 | ≥120 | Total | Pct |
Tampa Bay Rays | 162 | 55 | 19 | 0 | 74 | 46% |
Chicago Cubs | 162 | 73 | 16 | 0 | 89 | 55% |
Texas Rangers | 162 | 76 | 16 | 1 | 93 | 57% |
New York Mets | 162 | 89 | 5 | 0 | 94 | 58% |
Miami Marlins | 162 | 84 | 12 | 0 | 96 | 59% |
Pittsburgh Pirates | 162 | 93 | 5 | 0 | 98 | 60% |
San Diego Padres | 162 | 79 | 18 | 1 | 98 | 60% |
Baltimore Orioles | 162 | 90 | 9 | 0 | 99 | 61% |
Los Angeles Angels | 162 | 74 | 25 | 0 | 99 | 61% |
Minnesota Twins | 162 | 81 | 20 | 0 | 101 | 62% |
Detroit Tigers | 162 | 91 | 11 | 0 | 102 | 63% |
Cleveland Guardians | 162 | 75 | 27 | 1 | 103 | 64% |
Los Angeles Dodgers | 162 | 73 | 30 | 1 | 104 | 64% |
League Average | 162 | 86 | 23 | 0 | 109 | 67% |
San Francisco Giants | 162 | 92 | 18 | 0 | 110 | 68% |
Philadelphia Phillies | 162 | 73 | 38 | 0 | 111 | 69% |
New York Yankees | 162 | 87 | 24 | 1 | 112 | 69% |
Arizona Diamondbacks | 162 | 96 | 17 | 0 | 113 | 70% |
Milwaukee Brewers | 162 | 87 | 26 | 0 | 113 | 70% |
Washington Nationals | 162 | 84 | 30 | 0 | 114 | 70% |
Colorado Rockies | 161 | 100 | 14 | 0 | 114 | 71% |
Boston Red Sox | 162 | 93 | 22 | 0 | 115 | 71% |
Kansas City Royals | 162 | 88 | 28 | 0 | 116 | 72% |
Toronto Blue Jays | 162 | 82 | 34 | 0 | 116 | 72% |
St. Louis Cardinals | 162 | 94 | 23 | 0 | 117 | 72% |
Seattle Mariners | 162 | 91 | 28 | 0 | 119 | 73% |
Atlanta Champs | 161 | 109 | 14 | 0 | 123 | 76% |
Cincinnati Reds | 162 | 81 | 46 | 0 | 127 | 78% |
Chicago White Sox | 162 | 82 | 45 | 0 | 127 | 78% |
Houston Astros | 162 | 96 | 33 | 0 | 129 | 80% |
Oakland Athletics | 162 | 99 | 33 | 0 | 132 | 81% |
Tampa Bay continues to lead the masses in controlling pitcher workloads, and it is tough to argue with them given they have a .550 or higher winning percentage in each of the past four seasons. They have also had to deal with injuries to multiple starters in that time including Tyler Glasnow, Yonny Chirinos, Blake Snell, Chris Archer, Brendan McKay and Brent Honeywell. Kevin Cash is an experienced manager, but he does not have the same years of experience as the triumvirate which ran the White Sox, Astros and Athletics last season, nor the old school bloodline of the Reds' skipper. Those clubs left their starters in games longer than any other teams in 2021. Bob Melvin's efforts in Oakland came out of necessity. His early-season bullpen usage put a strain on the group as the season wore on while Dusty Baker and Tony LaRussa fell back on old habits. One has to wonder where Houston would have ranked had Baker had Justin Verlander in the rotation.
Melvin takes his talents south on I-5 to San Diego, so it will be interesting to see if his tendencies hold up with a club which, on paper, has a good bullpen as well as a promising starting rotation. Baker does in fact get Verlander back in the rotation this year, but has also lost Zack Greinke and may not have Lance McCullers for a period of time. LaRussa has his full arsenal back, but could also lose Craig Kimbrel to a trade while the club has openly discussed moving Michael Kopech back into the rotation.
Run Support
Run support for starting pitching can be broken down into two components. The most popular one most of us consider is the overall offensive production of that team whereas we often overlook the runs that are produced while the starter is on the mound. Thankfully, Baseball-Reference breaks down both categories for us by RS/GS and RS/IP:
- RS/GS = Run Support per Game: Runs Scored/27 outs in the entire game when the pitcher started. The league average in 2021 was 4.6 runs per game
- RS/IP = Runs Support Per Innings: Runs Scored/27 outs while the pitcher was in the game as the pitcher. The league average was 4.3 runs per game
The table below sorts the teams by largest difference between runs scored by the team overall versus runs scored by the team when the starter was on the mound. I apologize in advance to those who had Zack Wheeler and Brandon Woodruff for re-opening some fresh wounds:
Team | RS/GS | RS/IP | Diff |
|---|---|---|---|
Tampa Bay Rays | 5.4 | 4.3 | -1.1 |
Philadelphia Phillies | 4.7 | 3.7 | -1.0 |
Milwaukee Brewers | 4.7 | 3.8 | -0.9 |
San Diego Padres | 4.6 | 3.9 | -0.7 |
New York Mets | 4.1 | 3.4 | -0.7 |
Seattle Mariners | 4.4 | 3.8 | -0.6 |
Atlanta Champs | 5.1 | 4.5 | -0.6 |
Detroit Tigers | 4.4 | 3.9 | -0.5 |
San Francisco Giants | 5.1 | 4.6 | -0.5 |
New York Yankees | 4.5 | 4.0 | -0.5 |
Arizona Diamondbacks | 4.2 | 3.7 | -0.5 |
Miami Marlins | 3.9 | 3.4 | -0.5 |
Pittsburgh Pirates | 3.9 | 3.4 | -0.5 |
Texas Rangers | 3.9 | 3.4 | -0.5 |
Colorado Rockies | 4.7 | 4.3 | -0.4 |
Chicago Cubs | 4.5 | 4.1 | -0.4 |
St. Louis Cardinals | 4.5 | 4.1 | -0.4 |
Minnesota Twins | 4.6 | 4.2 | -0.4 |
Baltimore Orioles | 4.1 | 3.7 | -0.4 |
Cincinnati Reds | 4.9 | 4.6 | -0.3 |
Los Angeles Angels | 4.6 | 4.3 | -0.3 |
Kansas City Royals | 4.3 | 4.1 | -0.2 |
Houston Astros | 5.4 | 5.3 | -0.1 |
Los Angeles Dodgers | 5.2 | 5.1 | -0.1 |
Boston Red Sox | 5.3 | 5.2 | -0.1 |
Cleveland Guardians | 4.6 | 4.5 | -0.1 |
Washington Nationals | 4.6 | 4.5 | -0.1 |
Oakland Athletics | 4.7 | 4.7 | 0.0 |
Toronto Blue Jays | 5.5 | 5.6 | 0.1 |
Chicago White Sox | 5.1 | 5.3 | 0.2 |
Run support is anything but sticky year over year, but the table below shows how each team has fared over the past three years as well as the average difference between their RS/GS and RS/IP:
Team | 2021 Diff | 2020 Diff | 2019 Diff | Avg |
Philadelphia Phillies | -1.0 | -0.5 | 0.2 | -0.4 |
San Francisco Giants | -0.5 | -0.1 | -0.3 | -0.3 |
Minnesota Twins | -0.4 | -0.1 | 0.0 | -0.2 |
Boston Red Sox | -0.1 | 0.0 | 0.0 | 0.0 |
New York Yankees | -0.5 | 0.0 | 0.5 | 0.0 |
Cincinnati Reds | -0.3 | 0.2 | 0.2 | 0.0 |
Oakland Athletics | 0.0 | 0.1 | 0.0 | 0.0 |
Baltimore Orioles | -0.4 | 0.5 | 0.0 | 0.0 |
Houston Astros | -0.1 | 0.0 | 0.3 | 0.1 |
Kansas City Royals | -0.2 | 0.3 | 0.1 | 0.1 |
Tampa Bay Rays | -1.1 | 0.6 | 0.7 | 0.1 |
Seattle Mariners | -0.6 | 0.4 | 0.5 | 0.1 |
Milwaukee Brewers | -0.9 | 0.6 | 0.6 | 0.1 |
Pittsburgh Pirates | -0.5 | 0.2 | 0.6 | 0.1 |
Los Angeles Angels | -0.3 | 0.3 | 0.4 | 0.1 |
Chicago Cubs | -0.4 | 0.4 | 0.5 | 0.2 |
New York Mets | -0.7 | 0.7 | 0.5 | 0.2 |
San Diego Padres | -0.7 | 0.7 | 0.5 | 0.2 |
Cleveland Guardians | -0.1 | 0.4 | 0.2 | 0.2 |
Detroit Tigers | -0.5 | 1.1 | 0.0 | 0.2 |
Miami Marlins | -0.5 | 0.5 | 0.6 | 0.2 |
Texas Rangers | -0.5 | 0.8 | 0.3 | 0.2 |
Arizona Diamondbacks | -0.5 | 0.6 | 0.5 | 0.2 |
Washington Nationals | -0.1 | 0.0 | 0.8 | 0.2 |
St. Louis Cardinals | -0.4 | 0.5 | 0.7 | 0.3 |
Colorado Rockies | -0.4 | 0.7 | 0.6 | 0.3 |
Chicago White Sox | 0.2 | 0.6 | 0.4 | 0.4 |
Atlanta Champs | -0.6 | 1.0 | 0.8 | 0.4 |
Los Angeles Dodgers | -0.1 | 0.9 | 0.6 | 0.5 |
Toronto Blue Jays | 0.1 | 1.2 | 0.7 | 0.7 |
Philadelphia once again shows up in an unfortunate spot on the list, but the Jays show up on the other end of the chart. Their offense was a run producing machine last season anywhere they called home, and Steven Matz was most appreciative of the team's production in 2021:
Name | Team | RS/GS | RS/IP▼ |
TOR | 6.0 | 7.5 | |
SDP | 6.8 | 6.6 | |
TOR | 6.3 | 6.6 | |
HOU | 6.8 | 6.6 | |
CLE | 5.8 | 6.5 | |
CHW | 5.8 | 6.4 | |
LAD | 6.2 | 6.4 | |
HOU | 6.1 | 6.3 | |
CHW | 6.1 | 6.0 | |
CIN | 5.7 | 5.9 | |
BOS | 5.2 | 5.9 | |
LAD | 5.6 | 5.8 | |
BOS | 5.7 | 5.6 | |
CLE | 5.1 | 5.5 | |
ATL | 5.6 | 5.4 | |
TOT | 5.5 | 5.4 | |
OAK | 4.9 | 5.3 | |
COL | 4.7 | 5.3 | |
CIN | 6.3 | 5.3 | |
ATL | 4.6 | 5.3 |
I know I have been openly critical of Matz this winter while others are looking forward to that infield defense working behind his groundball approach, but the St. Louis offense provided 1.5 fewer runs per outing than the Jays starters received last season, and the wins were a big part of Matz's fantasy resurgence last season. A most recent comparison for Matz would be Eduardo Rodriguez, who had six-plus runs of support in 15 of his 19 wins in 2019. He missed all of 2020, but then fell back to 13 wins in 2021 for the same Boston club as he saw that level of run support just six times last season.
Over the past three seasons, these are the top 10 pitchers who have most frequently received six-plus runs of support and their win-loss records in those outings:
Player | Split | Team(s) | From | To | W▼ | L | ERA | GS |
|---|---|---|---|---|---|---|---|---|
6+ Runs Scored | HOU/NYY | 2019 | 2021 | 28 | 0 | 1.99 | 33 | |
6+ Runs Scored | LAD | 2019 | 2021 | 24 | 0 | 2.50 | 29 | |
6+ Runs Scored | LAD/TOR | 2019 | 2021 | 23 | 2 | 3.35 | 32 | |
6+ Runs Scored | ATL | 2019 | 2021 | 22 | 2 | 3.34 | 33 | |
6+ Runs Scored | SEA | 2019 | 2021 | 21 | 0 | 3.28 | 26 | |
6+ Runs Scored | COL | 2019 | 2021 | 20 | 2 | 4.45 | 34 | |
6+ Runs Scored | BOS | 2019 | 2021 | 20 | 1 | 3.99 | 33 | |
6+ Runs Scored | MIN/TOR | 2019 | 2021 | 19 | 2 | 4.05 | 28 | |
6+ Runs Scored | TOR | 2019 | 2021 | 19 | 1 | 4.26 | 29 | |
6+ Runs Scored | HOU | 2019 | 2021 | 19 | 0 | 3.76 | 30 |
Surprise: pitchers on good teams get run support, but that does not mean we can simply just eliminate pitchers on bad teams.
Beneficial conditions for Relief Pitching Wins
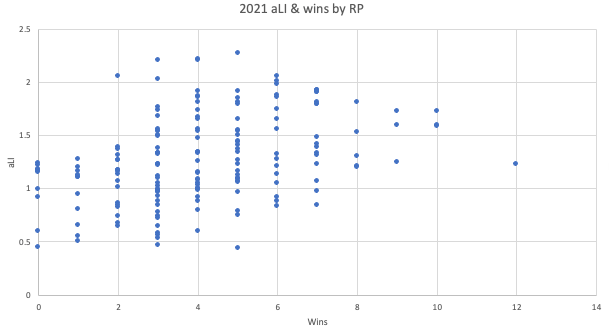
aLI: Average Leverage Index = The average pressure the pitcher saw in a game or season. 1.0 is average pressure, below 1.0 is low pressure and above 1.0 is high pressure.
In order to win games, it really helps if a reliever is coming into games where there is at least an average amount of pressure. Brent Suter was a unicorn this past season winning 12 games in relief for Milwaukee, but he was one of four pitchers with double-digit wins in relief joining Alex Reyes, Chad Green and Paul Sewald. Suter had the lowest aLI of that quartet.
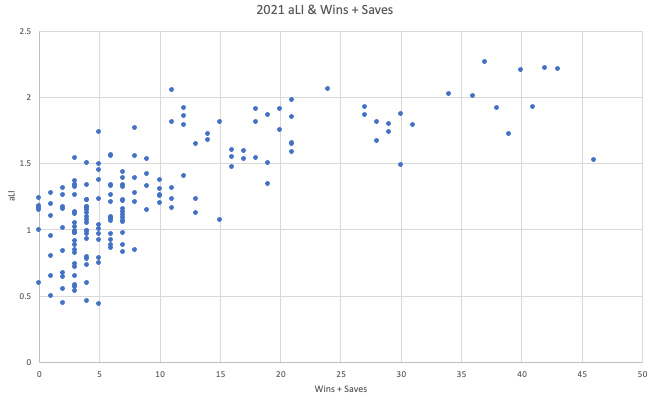
Closers, for the most part, will have the highest of the leverage indexes. If we combine wins and saves into the chart above, it changes just a bit:
Reliever wins tend to fall onto teams with good winning percentages. These are the 2021 relievers with eight or more wins and their respective team's winning percentage:
Name | Relief Wins | Team Winning% |
|---|---|---|
12 | .586 | |
10 | .556 | |
10 | .556 | |
10 | .568 | |
9 | .617 | |
9 | .568 | |
9 | .475 | |
8 | .574 | |
8 | .586 | |
8 | .568 | |
8 | .531 | |
8 | .568 |
If you are going to look to add non-closers to your roster who are not being added for their potential to save games, look for relievers who are working on winning teams.
Appear When Club is Tied or Ahead
The scatterplot below shows pitchers with fewer than 15 save opportunities who were used most frequently when the club was tied or ahead in the game. In broadcast speak, they were members of the A bullpen:
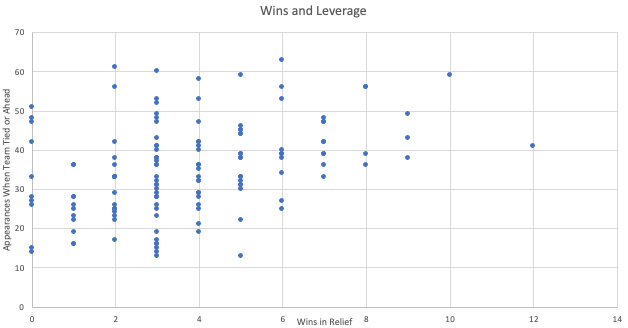
Once again, relievers on good teams in these situations have a better chance of getting the most wins out of relief. The problem is these fortunes can come and go with the wind. Yusmeiro Petit had seven wins in relief before June and saw just one more the rest of the season.
Chase Relievers whose starters do not work deep into games
The table below is a reverse sort of teams by wins from their bullpen. Five of the top six teams had winning percentages over .500 with Seattle being the highest ranking club by percentage of outings with at least 80 pitches by the starting pitcher:
Tm | Outings >= 80 Pitches | Relief Wins |
Tampa Bay Rays | 46% | 58 |
Seattle Mariners | 73% | 49 |
New York Yankees | 69% | 48 |
New York Mets | 58% | 45 |
San Francisco Giants | 68% | 45 |
Milwaukee Brewers | 70% | 44 |
San Diego Padres | 60% | 43 |
Detroit Tigers | 63% | 42 |
Philadelphia Phillies | 69% | 42 |
Boston Red Sox | 71% | 42 |
Los Angeles Dodgers | 64% | 41 |
Los Angeles Angels | 61% | 37 |
St. Louis Cardinals | 72% | 36 |
Miami Marlins | 59% | 35 |
Minnesota Twins | 62% | 34 |
Pittsburgh Pirates | 60% | 33 |
Kansas City Royals | 72% | 33 |
Cleveland Guardians | 64% | 32 |
Colorado Rockies | 71% | 32 |
Chicago White Sox | 78% | 32 |
Houston Astros | 80% | 32 |
Atlanta Champs | 76% | 31 |
Chicago Cubs | 55% | 30 |
Toronto Blue Jays | 72% | 30 |
Oakland Athletics | 81% | 29 |
Baltimore Orioles | 61% | 28 |
Cincinnati Reds | 78% | 28 |
Texas Rangers | 57% | 27 |
Washington Nationals | 70% | 23 |
Arizona Diamondbacks | 70% | 22 |
As wins continue to become more dispersed around the league, it behooves you to look into the trends and where these wins are coming from. Predicting wins is a step above predicting the weather, but you can at least put yourself in the best position possible to help your fantasy team.