With the exception of the COVID-shortened 2020 season, I've attempted to determine 5x5 hitting and pitching category targets, culling data from the NFBC's 15-team Main Event, 12-team RotoWire Online Championship and the 15-team TGFBI contests. My use of those leagues stems from the availability of the data, the uniformity of the leagues, the quality of the competition and the sheer volume of leagues. I understand it won't port perfectly to all mixed leagues — there's a platform bias, as the overall contests skew certain categories like saves and stolen bases — but I think it gives you a general idea of what you need to compete in each category.
We'll focus on the hitting categories with this article and then target the pitching categories separately. Before we look at last year's league-wide stats, and discuss the complications with previous year's stats, you may have heard a thing or two about the league-wide rule changes in the game, and their implications for the fantasy game. If you haven't, please direct your attention to this article and the links within.
It's been awhile since baseball has had a "normal" year. Be it because of Happy Fun Ball, COVID, recovering from COVID, the ban on "sticky stuff" for pitchers, subsequent manipulation of the ball by the league or the owners' lockout, there's been an extraneous factor impacting hitter numbers each year. That said, there was a considerable drop in offensive production across the league last season. The league as a whole hit only
With the exception of the COVID-shortened 2020 season, I've attempted to determine 5x5 hitting and pitching category targets, culling data from the NFBC's 15-team Main Event, 12-team RotoWire Online Championship and the 15-team TGFBI contests. My use of those leagues stems from the availability of the data, the uniformity of the leagues, the quality of the competition and the sheer volume of leagues. I understand it won't port perfectly to all mixed leagues — there's a platform bias, as the overall contests skew certain categories like saves and stolen bases — but I think it gives you a general idea of what you need to compete in each category.
We'll focus on the hitting categories with this article and then target the pitching categories separately. Before we look at last year's league-wide stats, and discuss the complications with previous year's stats, you may have heard a thing or two about the league-wide rule changes in the game, and their implications for the fantasy game. If you haven't, please direct your attention to this article and the links within.
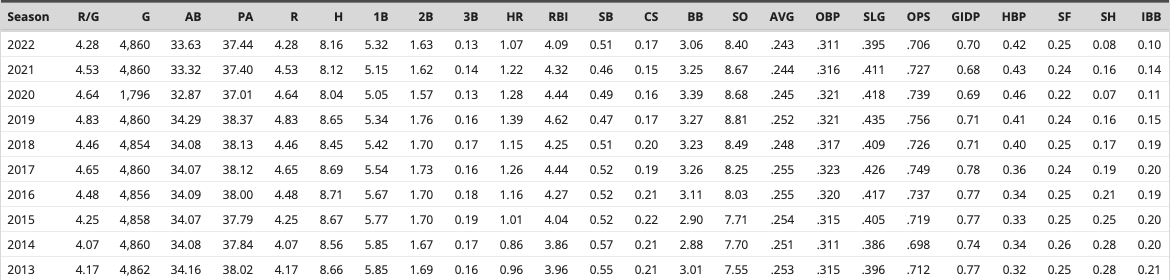
It's been awhile since baseball has had a "normal" year. Be it because of Happy Fun Ball, COVID, recovering from COVID, the ban on "sticky stuff" for pitchers, subsequent manipulation of the ball by the league or the owners' lockout, there's been an extraneous factor impacting hitter numbers each year. That said, there was a considerable drop in offensive production across the league last season. The league as a whole hit only .243, the sixth-lowest league-wide batting average of all time and the lowest since 1968, a season so bad that the league lowered the mound afterward. There were only 1.07 homers hit per team per game, the lowest since 2015, and 4.28 runs per game. One can see why baseball saw a need to boost offense in the game, though one can also quibble with MLB's methods for doing so. You can see the full seasonal averages since 2013 here:
As with previous seasons, I'm going to list the 80th/70th/50th percentiles for each category in the NFBC Main Event, TGFBI, and the RotoWire Online Championship, but I'm going to eschew listing the 20th percentile. Nobody shoots for just getting the 20th percentile in a category, and if you're so inclined to dig for that information, it's available if you've played in any of those contests, under the "My Historical Teams" link under "My Teams." Why 80/70? Eighty percent is roughly what you need to average in each category to win your individual league, and 70 percent to cash.
Let's take a look at each category. As with last year's article, I skipped 2020's data due to all the anomalies of that season. I'm pulling from the Main Event, TGFBI and the RotoWire Online Championship for the data.
Batting Average
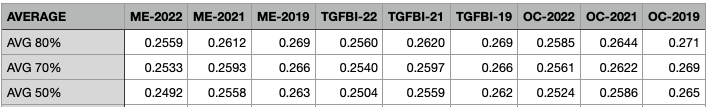
ME = NFBC Main Event; TGFBI = The Great Fantasy Baseball Invitational; OC = RotoWire Online Championship
If MLB had their worst batting average season collectively since the raised mound era, it follows that we had the same in fantasy baseball. That said, doing this exercise laid bare just how bad it was last year and why MLB felt the urgent need to increase batting average on balls in play by limiting the shift. Last year's 80th percentile batting average would have only gotten you a 50th percentile result in 2021. If you look back to 2019, it's even worse — that .2559 batting average would have only netted a 20th percentile result.
Jason Collette's work last fall suggested that the shift was responsible for a seven to eight percent decline in batting average on ground balls and line drives, so that's where we'll likely see some gains back this year. I don't think we regain all of that, however. First, teams can still shift within the construct of the new rules, meaning that we'll still see the shortstop at second base, just not on the first-base side of the bag. It's not optimal, but it's still a shift against a pull-hitting lefty. Second, the continuing rise in velocity is another major factor in the decline of batting averages, and that's not going away. More pitchers than ever are going to Driveline or rival clinics to work on their velocity, their spin rate and other advancements that they can't make during the season.
Runs
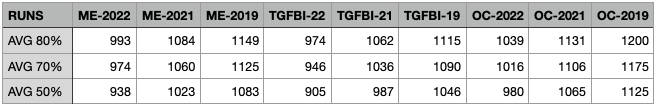
In 2021, the drop in runs scored, at least in terms of players rostered, didn't fully track along with the drop in batting average, but that wasn't the case last season. Runs per team dramatically dropped, so much that the 80th percentile in 2022 not only was 30 runs below the 50th percentile the previous year, but it was 16 runs below the 20th percentile in 2019! Major League Baseball believes that their new rules will not only boost batting average but will have a significant impact in runs scored. I hope it's true.
Home Runs
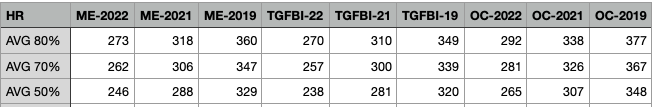
While homers were significantly down, we're still not necessarily producing dead-ball era stats. In fact, 2013 and 2014 called and asked us to hold their humidor for us. It seems to me that the league is reacting to trends and trying to put out fires when it comes to the liveliness of the ball, but it's difficult to have any sort of precision in making these adjustments. I'd prefer we stick in the Happy Fun Ball Era as we were in 2017-2019, but I don't think the league sees the homer production from 2022 as a problem.
I guessed wrong about the ball last year — I thought production would jump back up after 2021 represented a big drop. Instead, we had a second big drop. After needing around 23 homers per offensive slot in 2021 in 15-team leagues, we needed only 19.5 homers per slot last year. The composition of the ball really drives our discussion here, but considering that the moves made the league are trying to encourage more action and more balls in play, I don't know if we'll see a power rebound this year.
RBI
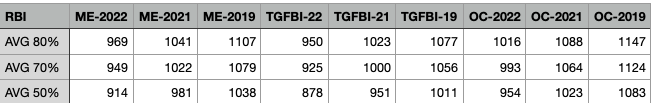
RBI totals have dropped in a similar fashion to runs scored — 2022's 80th percentile essentially equals 2019's 20th percentile. We needed 69 RBI per offensive slot to reach that number, plus a little bit more in one-catcher leagues.
Stolen Bases
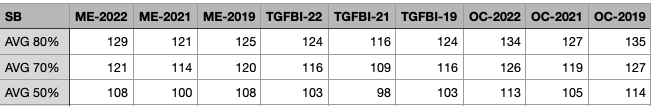
Stolen bases were the one category where production actually increased in 2022, jumping from 2,213 total swipes in 2021 to 2,486 in 2022, with the resultant rise in steals rostered in our leagues. I think it's interesting that stolen bases rostered in the Main Event have consistently outpaced those in TGFBI, despite the identical formats. But just because we had more steals last year doesn't mean we had a lot. MLB teams averaged 0.51 steals per game last year, well above 2021's 0.46 per game but still well less than we saw in 2011 and 2012, let alone the 80's and early 90's. If you rostered Jon Berti for his magical six weeks, you automatically did well in the category. But he didn't do much after that, and despite playing only 102 games, he led the majors with 41 steals. Only six players finished with 30 or more.
Of course, the new rules most definitely appear to boost stolen bases, so we'll likely get another bump in our need for speed. The obvious question is how much of a boost is there going to be? The pitch clock and limited pick-off attempts rules were implemented in Triple-A last year, so we can look to the experience at that level as a starting point. In 2021, there were 2,752 stolen bases between the International League and the Pacific Coast League, spanning 3,850 games, good for a rate of .71 steals per game. Last year, steals spiked to 4,161 over 4,474 games, good for .93 swipes per game.
I don't think that the jump at the major-league level will be as dramatic. First of all, notice that Triple-A teams were starting at a much higher base in 2021. It follows that Triple-A pitchers aren't nearly as proficient at holding runners as major league pitchers are, not to mention big-league catchers will have quicker pop times. Moreover, every aspect of the game necessarily is analyzed more by teams at the big league level, thus I'd expect quicker adjustments from teams getting exploited by more stolen base attempts. So instead of a 20 percent increase in steals, I'd guess it'll be closer to 10 percent.
If that were the case, instead of 129 bags to reach the 80th percentile, we'd instead need 142. That's 10 swipes per offensive position, but as we know, steals aren't going to be dispersed evenly, nor will the increases evenly benefit putative runners. You should map out your draft strategy accordingly, especially in snake-draft leagues, and even more so in leagues that have an overall contest like the NFBC or TGFBI.
As always, you should use these category targets loosely. The ground that we're standing on is not very stable in a so-called normal year (I'm not sure such a season exists), let alone in a turbulent year like this one with all the new rules changes.