
The assumption was, scoring would increase as the weather warmed up, though the parachute ball would temper the improvement. For a while, that's what happened, but runs have been declining for a few weeks.
Analyzing data via a rolling average helps smooth outliers and gives a better idea of trends. As such, the ensuing graphs use a three-week rolling average on the X-axis. Data was collected though Monday, July 4, so the last point is three days short of three weeks. The 2022 data points are as follows:
Period | Begin | End |
|---|---|---|
1 | 4/7 | 4/27 |
2 | 4/14 | 5/4 |
3 | 4/21 | 5/11 |
4 | 4/28 | 5/18 |
5 | 5/5 | 5/25 |
6 | 5/12 | 6/1 |
7 | 5/19 | 6/8 |
8 | 5/26 | 6/15 |
9 | 6/2 | 6/22 |
10 | 6/9 | 6/29 |
11 | 6/16 | 7/4 |
Data from 2019 and 2021 are from the corresponding weeks of those seasons.
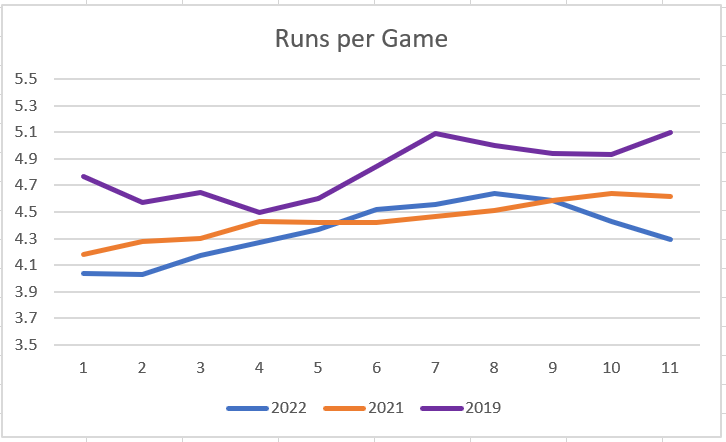
Runs peaked in Period 8 (May 26 through June 15) before trailing off the past few sessions. Scoring is still higher than it was initially, but the dip is surprising, even with the baseball not traveling as far.
Speaking of which, here is the corresponding home run data.
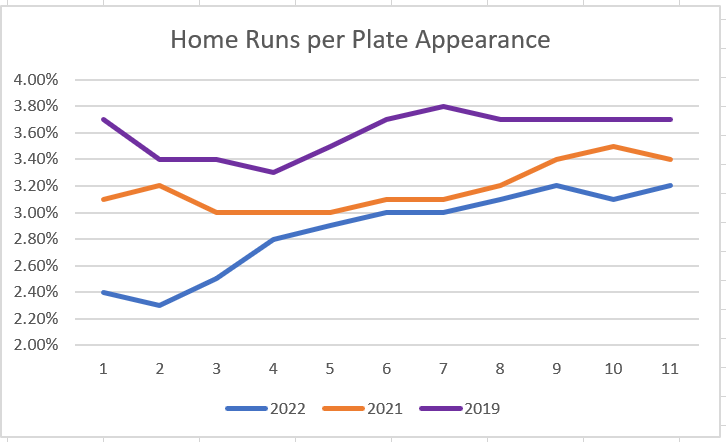
Like with runs, homers peaked in Period 9, but after a quick dip they recovered while runs continued to slide. Here is one reason explaining the patterns.
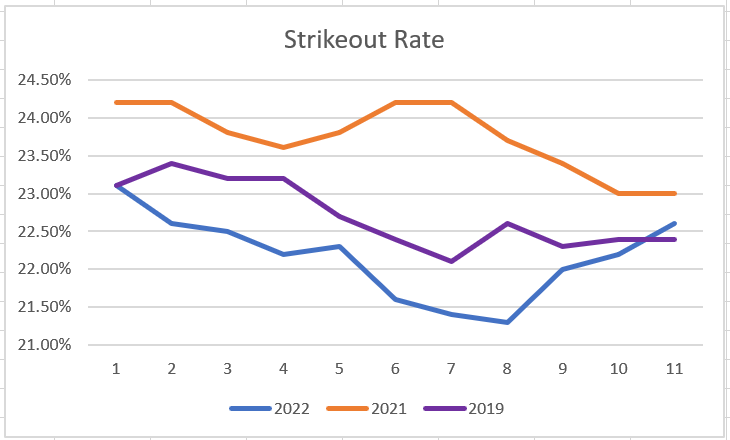
In late May/Early June, it certainly appeared batters were adjusting to the ball and putting it in play more often. It turns out that was just narrative, as strikeouts have spiked for the past several weeks.
Fewer balls
The assumption was, scoring would increase as the weather warmed up, though the parachute ball would temper the improvement. For a while, that's what happened, but runs have been declining for a few weeks.
Analyzing data via a rolling average helps smooth outliers and gives a better idea of trends. As such, the ensuing graphs use a three-week rolling average on the X-axis. Data was collected though Monday, July 4, so the last point is three days short of three weeks. The 2022 data points are as follows:
Period | Begin | End |
|---|---|---|
1 | 4/7 | 4/27 |
2 | 4/14 | 5/4 |
3 | 4/21 | 5/11 |
4 | 4/28 | 5/18 |
5 | 5/5 | 5/25 |
6 | 5/12 | 6/1 |
7 | 5/19 | 6/8 |
8 | 5/26 | 6/15 |
9 | 6/2 | 6/22 |
10 | 6/9 | 6/29 |
11 | 6/16 | 7/4 |
Data from 2019 and 2021 are from the corresponding weeks of those seasons.
Runs peaked in Period 8 (May 26 through June 15) before trailing off the past few sessions. Scoring is still higher than it was initially, but the dip is surprising, even with the baseball not traveling as far.
Speaking of which, here is the corresponding home run data.
Like with runs, homers peaked in Period 9, but after a quick dip they recovered while runs continued to slide. Here is one reason explaining the patterns.
In late May/Early June, it certainly appeared batters were adjusting to the ball and putting it in play more often. It turns out that was just narrative, as strikeouts have spiked for the past several weeks.
Fewer balls are being put in play. What is their fate?
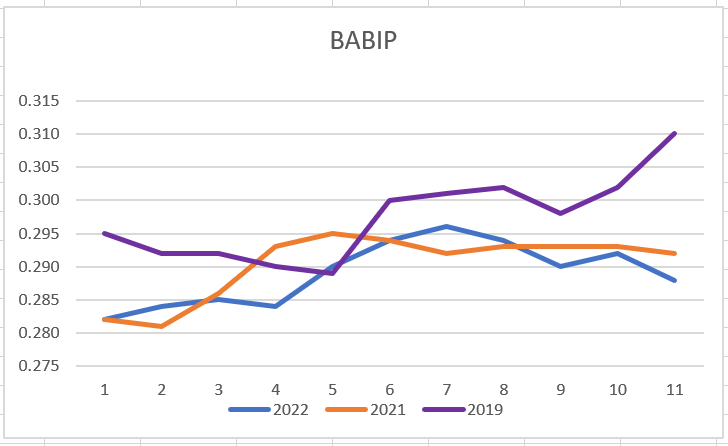
As it has the past few seasons, BABIP started low then rose, but this season the trend reversed around Period 7. Here is the final piece to the puzzle:
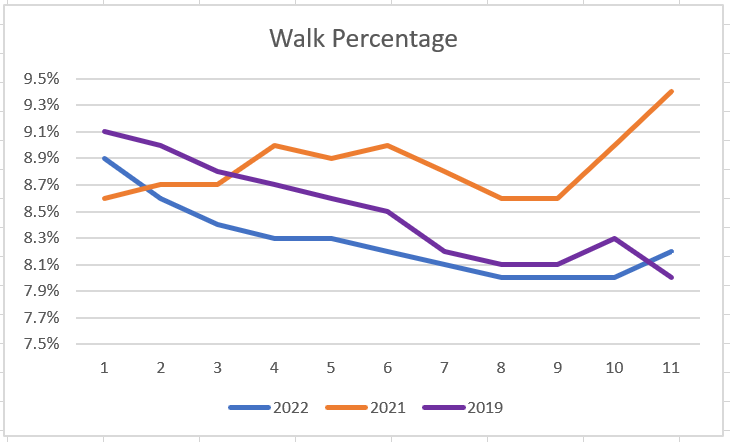
This season mimics last season in terms of free passes, with some deviation over the recent weeks.
So even though homers have been steady for a few weeks, fewer balls in play and fewer hits on the balls in play have dampened scoring.
It's dangerous to take too much from these trends when managing your roster over the second half. One takeaway could be more punchouts and fewer runs facilitate pitcher streaming, but this season streaming has been all about picking on the dregs as opposed to leveraging leaguewide patterns.
The above is meant to serve as a backdrop for the intended purpose of this discussion, but the dip in runs threw me for a loop, especially since it comes while homers are at worst leveling off. The topic I want to investigate is how the average flyball distance is being affected by the humidor.
In full disclosure, I embarked on this exercise knowing the results will not be actionable, as the sample is just too small. Not only that, my studies suggest average flyball distance correlates very well with a batter's HR/FB, but it isn't very useful for analyzing pitchers or parks. To clear, Mike Podhorzer of Fangraphs did the hitter research, the rest is mine. A pitcher's average flyball distance doesn't correlate with their HR/FB, and adjusting either a hitter or pitcher's homers via park factor makes the correlation worse, not better. Even so, if the introduction of a humidor increases flyball distance, homers should increase, and vice versa. It's just that there are so many other factors, the effect may not manifest in just under 40 games.
Here is the average flyball distance per venue, compared to the same time frame in 2019 and 2021. Data from the home and visiting teams are incorporated for each locale.
| Team | 2022 | 2021 | 2019 | |
|---|---|---|---|---|
| 1 | Angels | 322.1 | 328.1 | 322.8 |
| 2 | Astros*** | 311.6 | 313.8 | 325.7 |
| 3 | Athletics | 308.7 | 310.0 | 318.8 |
| 4 | Blue Jays***+ | 323.7 | 321.1 | 331.3 |
| 5 | Atlanta | 320.9 | 323.4 | 331.5 |
| 6 | Brewers | 315.3 | 314.0 | 323.0 |
| 7 | Cardinals*** | 319.8 | 314.5 | 328.7 |
| 8 | Cubs | 316.1 | 318.3 | 321.3 |
| 9 | D-backs** | 318.3 | 327.0 | 331.5 |
| 10 | Dodgers | 311.6 | 315.5 | 316.1 |
| 11 | Giants | 311.4 | 321.4 | 317.6 |
| 12 | Guardians | 311.9 | 320.4 | 320.4 |
| 13 | Mariners*** | 303.5 | 313.3 | 323.0 |
| 14 | Marlins*** | 313.7 | 311.5 | 316.9 |
| 15 | Mets*** | 316.2 | 318.6 | 306.9 |
| 16 | Nationals | 317.5 | 315.9 | 325.5 |
| 17 | Orioles | 315.7 | 321.7 | 327.6 |
| 18 | Padres | 310.0 | 316.5 | 320.7 |
| 19 | Phillies | 309.8 | 315.6 | 318.7 |
| 20 | Pirates | 322.7 | 313.9 | 325.2 |
| 21 | Rangers*** | 317.1 | 320.3 | 331.9 |
| 22 | Rays | 320.9 | 318.4 | 322.3 |
| 23 | Red Sox*** | 318.5 | 325.3 | 326.0 |
| 24 | Reds | 310.6 | 322.9 | 320.2 |
| 25 | Rockies* | 327.1 | 334.5 | 343.2 |
| 26 | Royals | 317.0 | 320.9 | 324.5 |
| 27 | Tigers | 310.1 | 312.5 | 327.0 |
| 28 | Twins | 311.2 | 321.8 | 326.0 |
| 29 | White Sox | 314.7 | 315.1 | 323.2 |
| 30 | Yankees | 312.5 | 321.5 | 318.8 |
- * - began using a humidor in 2002
- ** - began using a humidor in 2018
- *** - began using a humidor in 2021
- + - played home games in Dunedin and Buffalo during the time of the study
Aside from small sample variance, accounting for the difference in drag hinders comparing the results. Along those lines, once the sample increases, the data from Minute Maid Field (Astros), Globe Life Park (Rangers) and Chase Field (D-backs) could prove useful since they all used a humidor last season and play most of their home game indoors, minimizing variables. If there is a decline in distance, it could be attributed to the humidor. Granted, 23 of 29 parks are experiencing a reduction in flyball distance (Blue Jays are excluded from the count), it's interesting to note the three parks cited with a roof are all incurring a drop in average flyball distance.
Admittedly, one of the impetuses for this study is the notion the humidor has transformed Busch Stadium in St. Louis into a home run park. The problem with that is the Cardinals installed a humidor before last season, so the added flyball distance so far can't be resulting from the humidor, unless the settings are different. More likely, it is noise.
The same is likely true for PNC Park in Pittsburgh, but since this is the first season the venue has used a humidor, there isn't any useful point of comparison.
I'm getting the shakes just thinking about how all of this will need to be rolled into 2023 projections. Not to mention, accounting for likely shift regulation and a more balanced schedule.