According to our MLB Injury Report page, there are 244 pitchers on the injured list in baseball, and that did not include the news that Zac Gallen was going to miss time with a UCL injury or Jose Urquidy being pulled from tonight's game after 44 pitches declining fastball velocity. The list includes any pitcher in the organization because any injured pitcher hits the availability depth chart in the organization or available to organizations. The breakdown is as such:
Team | Pitchers |
|---|---|
SD | 14 |
TB | 14 |
FA | 12 |
HOU | 12 |
LAD | 12 |
SEA | 12 |
TOR | 11 |
PIT | 10 |
BOS | 9 |
MIL | 9 |
NYY | 9 |
SF | 9 |
TEX | 9 |
CHC | 8 |
MIA | 8 |
STL | 8 |
WAS | 8 |
DET | 7 |
NYM | 7 |
ARI | 6 |
CWS | 6 |
LAA | 6 |
OAK | 6 |
BAL | 5 |
CLE | 5 |
KC | 5 |
CIN | 4 |
COL | 4 |
MIN | 4 |
PHI | 3 |
ATL | 2 |
Coming into this season, it was widely recognized we were dealing with unchartered waters in how pitchers would bounce back from the craziness of 2020. Never before had pitchers twice been asked to ramp up and get ready for a season, with rather short notice for the second ramp up. Once the abbreviated season began, most pitchers were used in a way they likely had not experienced since their prep days in high school or early college. Most seasons, teams like to keep the year-over-year workload increase within a 25 percent threshold, but that is not possible for 2021. Teams need to cobble together 1,458
According to our MLB Injury Report page, there are 244 pitchers on the injured list in baseball, and that did not include the news that Zac Gallen was going to miss time with a UCL injury or Jose Urquidy being pulled from tonight's game after 44 pitches declining fastball velocity. The list includes any pitcher in the organization because any injured pitcher hits the availability depth chart in the organization or available to organizations. The breakdown is as such:
Team | Pitchers |
|---|---|
SD | 14 |
TB | 14 |
FA | 12 |
HOU | 12 |
LAD | 12 |
SEA | 12 |
TOR | 11 |
PIT | 10 |
BOS | 9 |
MIL | 9 |
NYY | 9 |
SF | 9 |
TEX | 9 |
CHC | 8 |
MIA | 8 |
STL | 8 |
WAS | 8 |
DET | 7 |
NYM | 7 |
ARI | 6 |
CWS | 6 |
LAA | 6 |
OAK | 6 |
BAL | 5 |
CLE | 5 |
KC | 5 |
CIN | 4 |
COL | 4 |
MIN | 4 |
PHI | 3 |
ATL | 2 |
Coming into this season, it was widely recognized we were dealing with unchartered waters in how pitchers would bounce back from the craziness of 2020. Never before had pitchers twice been asked to ramp up and get ready for a season, with rather short notice for the second ramp up. Once the abbreviated season began, most pitchers were used in a way they likely had not experienced since their prep days in high school or early college. Most seasons, teams like to keep the year-over-year workload increase within a 25 percent threshold, but that is not possible for 2021. Teams need to cobble together 1,458 innings over a season, so they need either a high volume of arms or pitchers who are able to pick up where they left off in 2019.
Early on, there is a mixed bag of data on how the league is adjusting to the new frontier. The league, as a whole, appears to be easing its way back into normal pitching utilization. While the average starter is going slightly deeper into games than he did last year, the average pitch count by starters is up by only a handful while the percentage of outings with pitchers throwing 100 or more pitches (HighGM) is at its lowest point in recent years:
Season | Games | IP/GS | P/GS | Gm P>=100 | HighGms |
|---|---|---|---|---|---|
2015 | 4858 | 5.8 | 93 | 1862 | 38.3% |
2016 | 4856 | 5.6 | 93 | 1734 | 35.7% |
2017 | 4860 | 5.5 | 92 | 1574 | 32.4% |
2018 | 4862 | 5.4 | 88 | 1223 | 25.2% |
2019 | 4858 | 5.2 | 86 | 1167 | 24.0% |
2020 | 1796 | 4.8 | 80 | 251 | 14.0% |
2021 | 1050 | 5.1 | 84 | 116 | 11.0% |
This was honestly surprising to me as it has felt like the league has been allowing pitchers to work deeper into games, no-hitters and attempted no-hitters aside. The data looks a bit different when we break it down by team:
Tm | GS | IP/GS | Pit/GS | Gm P>=100 | HighGms |
|---|---|---|---|---|---|
CLE | 33 | 5.4 | 88 | 11 | 33% |
OAK | 37 | 5.5 | 89 | 10 | 27% |
PHI | 36 | 5.6 | 90 | 9 | 25% |
STL | 36 | 5.4 | 88 | 8 | 22% |
HOU | 36 | 5.3 | 88 | 6 | 17% |
KCR | 34 | 4.8 | 83 | 6 | 18% |
SFG | 36 | 5.7 | 87 | 6 | 17% |
BOS | 37 | 5.2 | 86 | 5 | 14% |
CHW | 33 | 5.4 | 89 | 5 | 15% |
COL | 35 | 5 | 84 | 5 | 14% |
LAD | 36 | 5.8 | 87 | 5 | 14% |
SEA | 36 | 5 | 82 | 5 | 14% |
NYY | 35 | 5.2 | 84 | 4 | 11% |
TBR | 37 | 4.6 | 72 | 4 | 11% |
WSN | 31 | 5.3 | 85 | 4 | 13% |
LAA | 35 | 4.6 | 83 | 3 | 9% |
TEX | 38 | 5 | 81 | 3 | 8% |
BAL | 36 | 5 | 82 | 2 | 6% |
CIN | 33 | 5 | 86 | 2 | 6% |
DET | 35 | 5 | 82 | 2 | 6% |
MIA | 35 | 5 | 79 | 2 | 6% |
MIN | 33 | 5.2 | 84 | 2 | 6% |
SDP | 36 | 4.5 | 77 | 2 | 6% |
ATL | 35 | 5 | 83 | 1 | 3% |
CHC | 35 | 4.8 | 80 | 1 | 3% |
MIL | 36 | 5.1 | 82 | 1 | 3% |
NYM | 30 | 5.1 | 78 | 1 | 3% |
PIT | 35 | 4.9 | 84 | 1 | 3% |
ARI | 36 | 5.3 | 86 | 0 | 0% |
TOR | 34 | 4.4 | 74 | 0 | 0% |
Cleveland knows they have horses in their rotation and manager Terry Francona is riding them aggressively early on as one-third of the starts made by Cleveland starting pitchers have gone into triple-digit pitch counts. Shane Bieber has the recent track record of carrying a big workload, but the rest of the young staff does not and most of the staff is likely to hit its 2020 workload totals by the end of May:
Pitcher | 2019 IP | 2020 IP | 2021 IP | YoY Diff |
|---|---|---|---|---|
214 | 77 | 55 | 22 | |
57 | 74 | 46 | 28 | |
115 | 55 | 40 | 15 | |
0 | 33 | 23 | 10 | |
MIN | 10 | 15 | (5) |
This situation bears watching given the lack of track record with those young arms, especially given McKenzie's slim frame. Cleveland does not exactly have the system depth to start cycling arms through, so things could get interesting this summer once the younger arms start reaching new workload levels. The confusing thing is that Cleveland has a talented bullpen, but their usage has been rather rigid in their roles and utilization. That is not the case with Oakland, whose early usage is concerning:
Pitcher | 2019 IP | 2020 IP | 2021 IP | YoY Diff |
|---|---|---|---|---|
144 | 63 | 48.1 | 15 | |
135 | 4 | 41 | (37) | |
68 | 54 | 41 | 13 | |
96 | 53 | 36 | 17 | |
55 | 59 | 28 | 31 |
Nobody on this staff has a track record of a big workload and is more well-known for their history dealing with injuries. Irvin at least had a decent workload in 2019 and worked 161 innings in 2018, but worked four innings last season while spending most of the season in the alternate site. Manager Bob Melvin leans heavily on Yusmeiro Petit, Lou Trivino and Jake Diekman out of the pen while trusting few other relievers so the starters have worked more than expected. Petit has already matched his 2020 workload, but if there were ever a rubber-armed reliever, it would be him. Given the injury history with the starting pitchers on this team, this feels like borrowed time for these guys as the workload numbers creep up this summer.
Philadelphia is coming off a season where its bullpen was historically awful, so one cannot blame it for hoping the starters could absorb more work this year. So far, so good on both accounts:
Pitcher | 2019 IP | 2020 IP | 2021 IP | YoY Diff |
|---|---|---|---|---|
202 | 71 | 47 | 24 | |
195 | 71 | 47 | 24 | |
163 | 59 | 45 | 14 | |
139 | 34 | 31 | 3 | |
117 | 34 | 23 | 11 |
This club at least has a decent track record of workload in previous seasons before 2020. This entire staff will exceed that 2020 workload by the end of the month, but Nola and Wheeler would be on pace to potentially triple their 2020 workload.
None of this mentions pitchers such as Marcus Stroman, Eduardo Rodriguez, Joe Ross, Domingo German, Jameson Taillon and Michael Kopech, who did not pitch at all in 2020, and all but Kopech is working in a rotation every fifth or sixth day. You could throw Corey Kluber into that mix given he was pulled in the first inning of his only outing last year. Overall we have a fair amount of pitchers who have already increased their workload from 2020 by 20 or more innings:
Pitcher | 2020 IP | 2021 IP | 20v21 Diff |
|---|---|---|---|
| 40 | 40 | |
3 | 41 | 38 | |
3 | 40 | 37 | |
1 | 35 | 34 | |
| 33 | 33 | |
| 31 | 31 | |
| 31 | 31 | |
| 28 | 28 | |
| 28 | 28 | |
| 28 | 28 | |
1 | 25 | 24 | |
7 | 31 | 24 | |
11 | 35 | 24 | |
7 | 30 | 23 | |
| 22 | 22 | |
| 22 | 22 | |
14 | 36 | 22 | |
20 | 41 | 21 | |
15 | 36 | 21 |
Pitchers like Pivetta, Rodon, Rodriguez, Ohtani and Kopech are off to excellent starts but each outing from here pushes us further and further into the unknown. Given the rate of pitching injuries we have already seen in 2021, I cannot help but think of the infamous quote from "The Hunt for Red October":
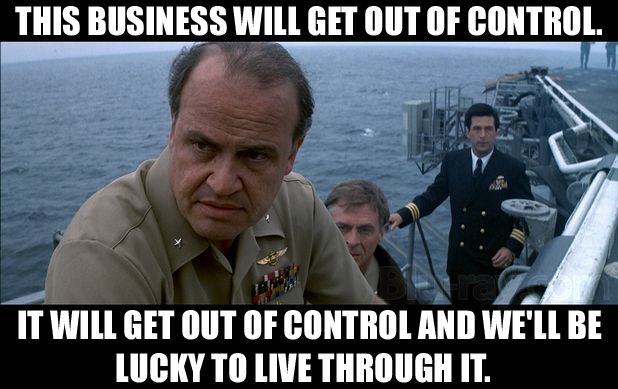
I hope I am wrong.