
Home runs are climbing, but still down compared to last season. Runs are also down, but not as much. Here are the numbers from June 1 - June 16 for the past two seasons:
| 2021 | 2022 | decrease | |
|---|---|---|---|
| HR/PA | 3.3% | 3.1% | 6.06% |
| R/G | 4.68 | 4.59 | 1.92% |
There has been a bunch of chatter concerning batters and how some are affected by the parachute ball. Speaking of which, here is a closeup view of the 2022 baseball:
The reduced flight is influencing pitchers too, but it hasn't garnered nearly as much attention. What follows is a review of the lowest home run rates (HR/PA) among qualified pitchers.
Before delving in, I've frequently cited Mike Podherzer's work at Fangraphs, which revealed average flyball distance to be a great predictor of homers for hitters with a strong .8 correlation between HR/PA and average fly ball distance. However, the correlation drops to .45 for pitchers, so each hurler's average flyball distance isn't nearly as useful to gauge expected homers allowed.
| IP | HR% | ERA | FIP | xFIP | WHIP | LOB% | K% | BB% | BABIP | HR/FB | GB% |
|---|---|---|---|---|---|---|---|---|---|---|---|
| 74.1 | 0.61% | 2.10 | 2.66 | 3.98 | 1.11 | 76.5% | 19.8% | 5.5% | 0.294 | 3.0% | 55.3% |
A common theme for the 10 pitchers discussed here will the discrepancy between FIP and xFIP. The difference between the ERA estimators is xFIP normalizes homers to the league mark. Both have benefits and shortcomings. The key is to understand what each illustrates and apply them in the proper context.
With that said, it is clear much of
Home runs are climbing, but still down compared to last season. Runs are also down, but not as much. Here are the numbers from June 1 - June 16 for the past two seasons:
| 2021 | 2022 | decrease | |
|---|---|---|---|
| HR/PA | 3.3% | 3.1% | 6.06% |
| R/G | 4.68 | 4.59 | 1.92% |
There has been a bunch of chatter concerning batters and how some are affected by the parachute ball. Speaking of which, here is a closeup view of the 2022 baseball:
The reduced flight is influencing pitchers too, but it hasn't garnered nearly as much attention. What follows is a review of the lowest home run rates (HR/PA) among qualified pitchers.
Before delving in, I've frequently cited Mike Podherzer's work at Fangraphs, which revealed average flyball distance to be a great predictor of homers for hitters with a strong .8 correlation between HR/PA and average fly ball distance. However, the correlation drops to .45 for pitchers, so each hurler's average flyball distance isn't nearly as useful to gauge expected homers allowed.
| IP | HR% | ERA | FIP | xFIP | WHIP | LOB% | K% | BB% | BABIP | HR/FB | GB% |
|---|---|---|---|---|---|---|---|---|---|---|---|
| 74.1 | 0.61% | 2.10 | 2.66 | 3.98 | 1.11 | 76.5% | 19.8% | 5.5% | 0.294 | 3.0% | 55.3% |
A common theme for the 10 pitchers discussed here will the discrepancy between FIP and xFIP. The difference between the ERA estimators is xFIP normalizes homers to the league mark. Both have benefits and shortcomings. The key is to understand what each illustrates and apply them in the proper context.
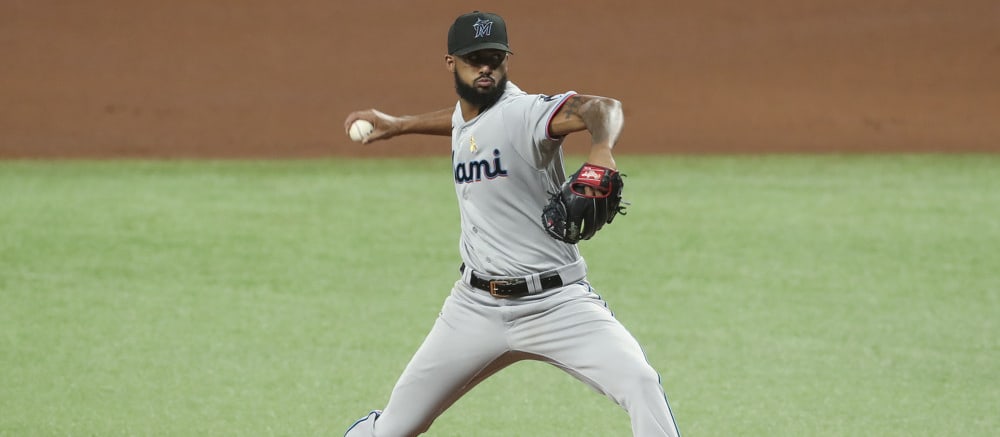
With that said, it is clear much of Perez's success is driven by the league's lowest HR% among qualified pitchers. He's certainly helping his cause with a frugal walk rate and a high groundball rate. Perez also benefits from a power-suppressing home venue, not to mention working in a division with other parks prone to keeping the ball in the yard.
About a week ago, Perez was tagged for 12 hits in five frames by the White Sox, resulting in six earned runs. This type of outing will occur to pitchers with pedestrian strikeout rates. Sometimes the ball finds a hole... repeatedly. Chances are, games of this nature will transpire a bit more frequently.
Perez's home run rate is also likely to increase. The caveat is the regression should land well below his career mark. The increase in groundball rate is by design, as Perez is throwing more sinkers in lieu of four-seamers and cutters.
Fewer flyballs as well as pitcher-friendly locales should help keep Perez's long balls in check for the duration of the season. Sure, he's vulnerable to the occasional blowup, but it likely won't be due to a cluster of homers. Avoid Perez against better lineups and he should be a fantasy asset over the next three-plus months.
| IP | HR% | ERA | FIP | xFIP | WHIP | LOB% | K% | BB% | BABIP | HR/FB | GB% |
|---|---|---|---|---|---|---|---|---|---|---|---|
| 70.2 | 0.65% | 3.21 | 1.79 | 3.37 | 1.26 | 66.1% | 26.1% | 3.6% | 0.369 | 2.9% | 43.3% |
Sure, Gausman has been fortunate in the home run department with a miniscule 2.9 percent home run per flyball mark, but he's been equally unlucky with a .369 BABIP and 66.1 percent left on base mark. What a weird profile.
Grounding everything is Gausman's K-BB%, checking in as the sixth highest among qualified starters. The only five hurlers besting his 22.5 percent mark are Shane McClanahan, Corbin Burnes, Aaron Nola, Gerrit Cole and Tarik Skubal. That's pretty awesome company and goes to show why K-BB% is such a useful down and dirty tool.
As far as fantasy takeaways, there really isn't much other than when everything fleshes out, Gausman's ERA isn't likely to fluctuate much, but he could incur a drop in WHIP as his BABIP normalizes.
| IP | HR% | ERA | FIP | xFIP | WHIP | LOB% | K% | BB% | BABIP | HR/FB | GB% |
|---|---|---|---|---|---|---|---|---|---|---|---|
| 81 | 1.20% | 2.78 | 3.35 | 3.81 | 1.15 | 75.8% | 20.5% | 8.4% | 0.269 | 13.8% | 67.5% |
Spoiler alert: Valdez's HR/FB is the only one in this discussion close to the league mark. That is, everyone else made the list due to some degree of luck, whereas Valdez's inclusion is solely based on a 67.5 percent groundball rate.
The 28-year-old southpaw's career groundball rate matches his 2022 level, so for the sake of this discussion, let's say his home run rate remains low. To be blunt, Valdez's fantasy managers should be concerned. His .269 BABIP is out of whack with such an extreme groundball level. Further, Valdez's K-BB% is the 11th lowest among the 61 qualified starters and based on his track record, it isn't likely to improve much if at all.
For his career, Valdez's expected ERA is between 3.50 - 4.00 which is in sync with his current 3.98 xFIP. However, his strikeout rate is a career low, and that's with working out of the windup an inordinate amount of time due to his lucky hit rate. While I'm not calling for an ERA north of 4.00 the rest of the way, it's plausible.
| IP | HR% | ERA | FIP | xFIP | WHIP | LOB% | K% | BB% | BABIP | HR/FB | GB% |
|---|---|---|---|---|---|---|---|---|---|---|---|
| 66.1 | 1.04% | 2.26 | 3.13 | 4.28 | 1.07 | 81.8% | 17.7% | 5.9% | 0.268 | 6.0% | 51.3% |
Blackburn's season is eerily similar to that of Valdez, except Blackburn doesn't have the pedigree of Valdez. I have no doubt backseat analysts will look at Blackburn's LOB%, BABIP and HR/FB and scream "LUCKY", as they should. They should do the same with Valdez, but the Astros' hurler will get the benefit of the doubt.
That said, Blackburn is walking fewer batters, so when everything normalizes (keep in mind regression doesn't punch a time clock, and Blackburn's 2022 numbers may not correct), his landing point should be a tad softer than his previous levels. That said, I want nothing to do with him, and if Oakland manages to deal him, he's likely to work in a more homer friendly park. Think of what happened to Kyle Gibson last season after he was traded. The regression monster followed him to Philadelphia.
| IP | HR% | ERA | FIP | xFIP | WHIP | LOB% | K% | BB% | BABIP | HR/FB | GB% |
|---|---|---|---|---|---|---|---|---|---|---|---|
| 91.1 | 1.14% | 1.68 | 2.99 | 3.58 | 0.96 | 81.2% | 23.4% | 7.7% | 0.245 | 5.4% | 53.6% |
Alcantara is an example of someone who is both good and lucky. His 15.7 K-BB% is nothing special. However, a .245 BABIP, 81.2 percent LOB and 5.4 percent HR/FB have all been blessed by Lady Luck.
But Todd, his Statcast card is bleeding!
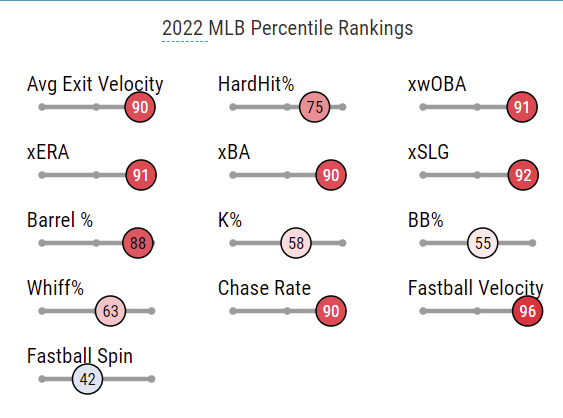
Let's not conflate cause and effect. The ability to sustain some of that red is tenuous. Specifically, the Avg Exit Velocity and HardHit% are in part fueled by luck, as is Barrel%. Again, luck doesn't always normalize, and a pitcher has some degree of control over those metrics, but Alcantara has enjoyed some good fortune beyond a low home run rate.
For the record, we're still looking at a very good pitcher whose fantasy worth is amplified by the volume of innings he compiles. Just don't get trapped into, "He's not lucky, he's that good."
| IP | HR% | ERA | FIP | xFIP | WHIP | LOB% | K% | BB% | BABIP | HR/FB | GB% |
|---|---|---|---|---|---|---|---|---|---|---|---|
| 63.1 | 1.07% | 2.69 | 2.36 | 3.40 | 1.04 | 74.5% | 27.8% | 5.3% | 0.306 | 4.0% | 46.3% |
As opposed to the last couple of pitchers, the only lucky element of Wheeler's start is the low home run rate. His groundball rate is a little lower than the past couple of seasons, so he could use the good HR/FB fortune. Sure, Wheeler's ERA is almost a run lower than expected, but an already low WHIP could improve as a .306 BABIP is a tad snake bit. Well... there is the Phillies' defense to consider, so maybe the BABIP doesn't decrease.
| IP | HR% | ERA | FIP | xFIP | WHIP | LOB% | K% | BB% | BABIP | HR/FB | GB% |
|---|---|---|---|---|---|---|---|---|---|---|---|
| 71 | 1.33% | 3.68 | 3.45 | 4.74 | 1.35 | 73.3% | 20.3% | 9.7% | 0.309 | 5.4% | 41.3% |
Some of these numbers surprise me. It seems every time I watch Kelly pitch, he's filling up the zone. Apparently, I don't watch him pitch much. I checked my records, I used him twice in DFS for what I perceived to be good matchups and he came through, so I must be fixated on those two efforts.
Anyway, it's clear Kelly is a big risk. Let's not waste time here.
| IP | HR% | ERA | FIP | xFIP | WHIP | LOB% | K% | BB% | BABIP | HR/FB | GB% |
|---|---|---|---|---|---|---|---|---|---|---|---|
| 73.2 | 1.37% | 2.57 | 2.88 | 3.58 | 1.03 | 76.6% | 27.4% | 8.6% | 0.264 | 7.1% | 50.8% |
After cyphering through the skill (strong strikeout rate) and luck (low BABIP and HR/FB), the question with Wright is can he sustain his elevated strikeout and reduced walk rates? They're both out of whack with historical levels. Wright has some prospect pedigree, but this leap is unexpected.
A high groundball rate should help keep homers in check, but as it gets even warmer and more humid, Truist Park will have trouble keeping the ball in the yard, with or without the parachute.
Now looks like a good time to cash out on Wright.
| IP | HR% | ERA | FIP | xFIP | WHIP | LOB% | K% | BB% | BABIP | HR/FB | GB% |
|---|---|---|---|---|---|---|---|---|---|---|---|
| 73 | 1.30% | 2.84 | 2.54 | 3.51 | 1.14 | 76.5% | 30.5% | 9.1% | 0.297 | 5.6% | 36.9% |
Rodon is another "not much to see here" guy. He's doing typical things... when healthy. Rodon's groundball rate is similar to last season. His HR/FB has been been aided by the ball, Oracle Park and, wait for it, a little luck. Rodon's strikeout and walk rates are a bit worse than last season, but that's to be expected after his breakout campaign. Home run normalization should increase his ERA, but with Rodon it remains all about health.
| IP | HR% | ERA | FIP | xFIP | WHIP | LOB% | K% | BB% | BABIP | HR/FB | GB% |
|---|---|---|---|---|---|---|---|---|---|---|---|
| 79.1 | 1.50% | 3.06 | 3.46 | 4.54 | 1.24 | 77.4% | 18.5% | 7.4% | 0.295 | 6.7% | 46.4% |
The guy's 40 years old, he deserves to go out on a high note. That said, if it weren't for a lucky HR/FB mark, Wainwright would be a league average pitcher. Busch Stadium and a solid Cardinals defense should help keep the correction reasonable, but it's coming.