It is funny how the brain works. I knew the article I wanted to write this week as we continue to watch runs pile up around the league, but little did I realize I wrote this exact same article nearly this exact same week last season. The league was hitting .248/.328/.398 with runners in scoring position last season as I penned that installment of this column, and I went into the data expecting to see a larger number this year given all the offense. Imagine my surprise when I see the league-wide triple-slash line with runners in scoring position this year so far is .254/.335/.413. The needle hasn't moved much, but the number of runners in scoring position has increased, mostly with the league's rediscovered interest in stealing bases.
The league as a whole is scoring 4.58 runs per game, which is up from the final total of 4.28 runs per game last season. Given the offense we're already seeing this month as the weather finally begins to warm up, we will very likely see that runs per game average creep up further. We can't possibly expect the run production to come from the same sources on a consistent basis. I doubt many people had Adolis Garcia leading the league in RBI to this point or had either Nolan Gorman or Alec Bohm in the top 50 for RBI let alone the top 10, yet here we are. I always find it helpful to look at where the RBI have
It is funny how the brain works. I knew the article I wanted to write this week as we continue to watch runs pile up around the league, but little did I realize I wrote this exact same article nearly this exact same week last season. The league was hitting .248/.328/.398 with runners in scoring position last season as I penned that installment of this column, and I went into the data expecting to see a larger number this year given all the offense. Imagine my surprise when I see the league-wide triple-slash line with runners in scoring position this year so far is .254/.335/.413. The needle hasn't moved much, but the number of runners in scoring position has increased, mostly with the league's rediscovered interest in stealing bases.
The league as a whole is scoring 4.58 runs per game, which is up from the final total of 4.28 runs per game last season. Given the offense we're already seeing this month as the weather finally begins to warm up, we will very likely see that runs per game average creep up further. We can't possibly expect the run production to come from the same sources on a consistent basis. I doubt many people had Adolis Garcia leading the league in RBI to this point or had either Nolan Gorman or Alec Bohm in the top 50 for RBI let alone the top 10, yet here we are. I always find it helpful to look at where the RBI have come from and where they could potentially come from moving forward to proactively prepare how I can adjust my roster as well as my expectations the rest of that season.
Rowdy Tellez was one of the RBI leaders at this point last year with 30 but finished outside the top 50 in the category the rest of the season with 60. Bryan Reynolds was struggling with RBI out of the gate yet drove in 56 the rest of the way once he righted the ship in Pittsburgh. Currently there are 20 players with at least 30 RBI on the season, while poor Jonathan Schoop has yet to drive in a run this season in 69 plate appearances. Let's now take a look at where the RBI are coming from and which players may have a surge coming while looking at how others are outperforming expectations. The foundation of this data is the the ever-useful Situational Batting Report from Baseball-Reference.
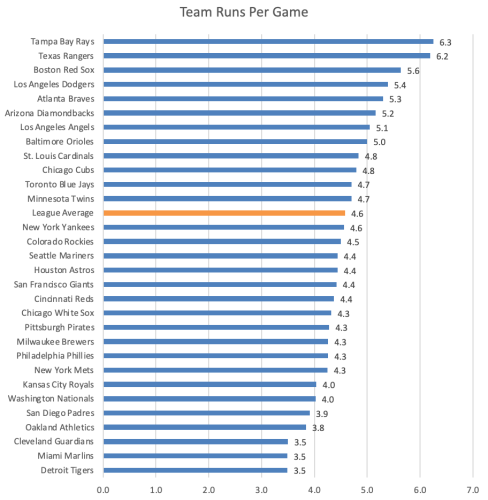
First, here is how your favorite team is doing in terms of generating runs this season, with my favorite team leading the pack and Paul Sporer's favorite team bringing up the rear:
The story behind these numbers is where it gets interesting, because some of these teams are simply wasting opportunities. The r-squared between runs per game and baserunners is .72, so there is an obvious strong correlation between the two, but we see how the margin for error is playing out as well. For example, Toronto leads the league in baserunners but is 12th in runs per game. Sure, the Marlins are both worst in the league in baserunners and runs scored per game, but how about the Yankees being 13th in runs per game despite being 28th in baserunners?
Team | Runs Per Game | Baserunners |
|---|---|---|
Toronto Blue Jays | 12th | 1st |
Boston Red Sox | 3rd | 2nd |
Texas Rangers | 2nd | 3rd |
St. Louis Cardinals | 9th | 4th |
Los Angeles Angels | 7th | 5th |
Chicago Cubs | 10th | 6th |
New York Mets | 23rd | 7th |
Tampa Bay Rays | 1st | 8th |
Washington Nationals | 25th | 9th |
Colorado Rockies | 14th | 10th |
Los Angeles Dodgers | 4th | 11th |
Baltimore Orioles | 8th | 12th |
Atlanta Braves | 5th | 13th |
Arizona Diamondbacks | 6th | 14th |
Oakland Athletics | 27th | 15th |
Cincinnati Reds | 18th | 16th |
Seattle Mariners | 16th | 17th |
San Diego Padres | 26th | 18th |
Minnesota Twins | 11th | 19th |
Philadelphia Phillies | 21st | 20th |
San Francisco Giants | 17th | 21st |
Pittsburgh Pirates | 20th | 22nd |
Kansas City Royals | 24th | 23rd |
Cleveland Guardians | 28th | 24th |
Chicago White Sox | 19th | 25th |
Houston Astros | 15th | 26th |
Milwaukee Brewers | 22nd | 27th |
New York Yankees | 13th | 28th |
Detroit Tigers | 29th | 29th |
Miami Marlins | 30th | 30th |
The league is plating 14.4 percent of its baserunners so far this season, but the correlation here drops to 0.53. This is why we have teams such as the White Sox who have an above-average rate of scoring baserunners but their runs per game remain below league average while their rivals up the Red Line are scoring an above-average number of runs while plating their baserunners at a below-average clip:
Team | Runs Per Game | % of Baserunners Scored |
|---|---|---|
Detroit Tigers | 3.5 | 12.0% |
Miami Marlins | 3.5 | 11.8% |
Cleveland Guardians | 3.5 | 12.5% |
Oakland Athletics | 3.8 | 11.6% |
San Diego Padres | 3.9 | 12.1% |
Washington Nationals | 4.0 | 13.6% |
Kansas City Royals | 4.0 | 14.0% |
New York Mets | 4.3 | 13.2% |
Philadelphia Phillies | 4.3 | 13.5% |
Milwaukee Brewers | 4.3 | 13.4% |
Pittsburgh Pirates | 4.3 | 14.3% |
Chicago White Sox | 4.3 | 14.5% |
Cincinnati Reds | 4.4 | 15.0% |
San Francisco Giants | 4.4 | 12.6% |
Seattle Mariners | 4.4 | 14.1% |
Houston Astros | 4.4 | 15.6% |
Colorado Rockies | 4.5 | 15.4% |
New York Yankees | 4.6 | 14.7% |
League Average | 4.6 | 14.4% |
Toronto Blue Jays | 4.7 | 13.5% |
Minnesota Twins | 4.7 | 14.3% |
Chicago Cubs | 4.8 | 14.1% |
St. Louis Cardinals | 4.8 | 14.1% |
Baltimore Orioles | 5.0 | 15.3% |
Los Angeles Angels | 5.1 | 15.2% |
Arizona Diamondbacks | 5.2 | 16.7% |
Atlanta Braves | 5.3 | 14.9% |
Los Angeles Dodgers | 5.4 | 15.9% |
Boston Red Sox | 5.6 | 17.1% |
Texas Rangers | 6.2 | 18.7% |
Tampa Bay Rays | 6.3 | 17.8% |
When you see a team like Toronto is just barely scoring above the league average despite the volume of runners they're putting on base, you wonder what could be if they could score runners at even an average rate. Conversely, how much worse could things get for Houston, who is scoring a below-average number of runs despite outperforming the league by 8.3 percent in terms of converting runners into runs?
One's team does not write a final sentence for a hitter's RBI production, but it certainly helps. Adolis Garcia leads the league in RBI with 46 as Texas has had both a high volume of baserunners and a high rate of plating those runners. Garcia has been a huge part of that, with vastly improved numbers with runners on base:
YR | PA | HR | RBI | AVG | OBP | SLG | BB% | K% |
|---|---|---|---|---|---|---|---|---|
2021 | 291 | 12 | 71 | .213 | .237 | .394 | 3.1% | 30.6% |
2022 | 308 | 13 | 87 | .270 | .321 | .500 | 6.2% | 24.4% |
2023 | 103 | 9 | 42 | .337 | .398 | .709 | 10.7% | 19.4% |
Hitting with runners in scoring position is not a skill, and has no statistical stickiness year over year, but you can certainly see how Garcia has improved in his approach at a high level in these situations when runners are on base. He drove in 101 runs over 156 games in 2022 and is nearly halfway there already in just 42 games this season. 23.4 percent of Garcia's baserunners have scored on his batted ball events, which is a high number, but not even the highest on his own team. Those of you with Jonah Heim on your roster know what I am talking about as he's driven in 29.4 percent of his baserunners this season, the highest percentage of any full-time player in the league. The next player on that list is Yordan Alvarez, who has plated 27.3 percent of his baserunners in Houston around his own injuries, the absence of Jose Altuve and some disappointing performances from Alex Bregman and Jose Abreu.
Overall, these are the players (min 100 PA) who are currently plating baserunners at a rate at least 50 percent better than league average. You either believe these players will continue such a pace or start to skate to where the puck is going for you statistically rather than where it is currently at:
Name | Tm | PA | BR | BRS | BRS% |
|---|---|---|---|---|---|
TEX | 148 | 85 | 25 | 29.4% | |
HOU | 160 | 110 | 30 | 27.3% | |
BAL | 181 | 103 | 28 | 27.2% | |
CHW | 188 | 97 | 26 | 26.8% | |
TEX | 201 | 107 | 28 | 26.2% | |
CIN | 136 | 100 | 25 | 25.0% | |
LAD | 100 | 57 | 14 | 24.6% | |
ARI | 140 | 78 | 19 | 24.4% | |
BOS | 184 | 125 | 30 | 24.0% | |
MIN | 142 | 88 | 21 | 23.9% | |
TBR | 149 | 101 | 24 | 23.8% | |
CHC | 164 | 76 | 18 | 23.7% | |
TOR | 106 | 76 | 18 | 23.7% | |
TBR | 132 | 85 | 20 | 23.5% | |
TEX | 181 | 141 | 33 | 23.4% | |
BOS | 160 | 104 | 24 | 23.1% | |
LAD | 119 | 66 | 15 | 22.7% | |
TBR | 185 | 119 | 27 | 22.7% | |
MIA | 111 | 53 | 12 | 22.6% |
There are as many expected names on that chart as there are unexpected names, and it's obviously the latter group you should focus on. We roster the likes of Alvarez, Semien, Devers, Mullins and Arozarena for their volume but never in our wildest dreams did we expect to see Heim or Paredes or Lowe producing at the volume they've currently produced. As someone who has both Paredes and Lowe on the same team, their surprising starts have certainly helped offset some slow (or non-existent) starts on other parts of my roster, but I am by no means banking on their volume the rest of the way. After all, Heim is hitting a Bondsian .392/.448/.667 with runners on base this season after hitting .250/.333/.393 in those same situations last year. Paredes hit .180/.294.327 with runners on last season and yet is a surprising .299/.347/.522 this year. He's on pace to eclipse his 2022 RBI total (45) sometime before Fathers' Day and could do so in half as many plate appearances.
Conversely, here is the list of hitters driving in runners at a rate at least 50 percent below the league average:
Name | Tm | PA | BR | BRS | BRS% |
|---|---|---|---|---|---|
BAL | 145 | 91 | 4 | 4.4% | |
MIA | 142 | 85 | 4 | 4.7% | |
OAK | 122 | 78 | 5 | 6.4% | |
OAK | 106 | 61 | 4 | 6.6% | |
PHI | 195 | 90 | 6 | 6.7% | |
TOR | 177 | 140 | 10 | 7.1% | |
CLE | 160 | 99 | 7 | 7.1% | |
CLE | 160 | 85 | 6 | 7.1% | |
HOU | 110 | 67 | 5 | 7.5% |
I leave Maldonado and Segura on there for mono-league players who have to roster such players due to lack of availability in the pool, but even in that format, it's tough to roster either player right now. Baltimore is better than league average in runs and in scoring baserunners, but Henderson hasn't helped the latter with his lack of hitting. He's generated runs with his 18 percent walk rate and .345 on-base percentage, but his .195 average is not moving players on the bases and he has just eight RBI on the season. There has to be more production coming from him at some point. Oakland is league average in getting runners on, but it's been the Brent Rooker show for RBI because neither Laureano nor Aguilar has done much with runners on base.
It's even worse in Cleveland, where both Rosario and Gimenez, who both took big steps forward last season, are just not plating anyone this year. The duo has combined for 17 RBI in 320 plate appearances, even with Steven Kwan getting on base 36 percent of the time in front of Rosario and Josh Bell recording a .341 on-base percentage in front of Gimenez. The lack of thump in the Cleveland lineup this year has made it particularly challenging for them to produce runs in bunches. Turner may be afflicted by the Colton & Wolfman first-year free-agent curse, but it certainly doesn't help that Bryson Stott is rarely on base in front of Turner. Philadelphia has struggled most of the season to produce offense and the recent return of Bryce Harper hasn't moved the needle too much.
The most interesting case of them all is Varsho. We've already learned how Toronto has had the most baserunners this season and yet sits 12th in runs per game. Varsho leads the club with 100 plate appearances with men on base this season, driving in 12 runners while hitting .224/.320/.353 in those situations. He hit .245 in that with runners on base over the past two seasons while slugging .410, so he's found success before. His current production has to be very disappointing for teams who bought into his catcher eligibility and the changes in Rogers Centre, so there's a chance you could get Varsho at a fair price in trading leagues as the owner stares at the disappointing stat line that he's produced. The Toronto offense will start to take advantage of this volume, and Varsho continues to hit smack dab in the middle of this lineup, putting him in prime position to rapidly accelerate his RBI production as the Toronto offense begins to turn the corner.
Offense will continue to rise in these coming weeks, and it will likely begin to come from different sources than what we've seen these past seven weeks. Plan accordingly.