
Last week, Lord Zola tweeted his sage advice on how most player production has peaks and valleys within a season:
You know, after five months of seeing tweets of MLB player stats with arbitrary endpoints, I'm beginning to think the season consists of a series of peaks and valleys...
— Todd Zola (@ToddZola) August 28, 2018
He is absolutely correct in that we can likely find great numbers for any player, even Chris Davis this season if we dig deep enough. Yet over the course of a season, the numbers typically play out. Buchholz seems to take that to an extreme from season to season over the last few seasons:
2012: 189 innings, 11 wins, 4.56 ERA (4.65 FIP)
2013: 108 innings, 12 wins, 1.74 ERA (2.78 FIP)
2014: 170 innings, 8 wins, 5.34 ERA (4.01 FIP)
2015: 113 innings, 7 wins, 3.26 ERA (2.68
Last week, Lord Zola tweeted his sage advice on how most player production has peaks and valleys within a season:
You know, after five months of seeing tweets of MLB player stats with arbitrary endpoints, I'm beginning to think the season consists of a series of peaks and valleys...
— Todd Zola (@ToddZola) August 28, 2018
He is absolutely correct in that we can likely find great numbers for any player, even Chris Davis this season if we dig deep enough. Yet over the course of a season, the numbers typically play out. Buchholz seems to take that to an extreme from season to season over the last few seasons:
2012: 189 innings, 11 wins, 4.56 ERA (4.65 FIP)
2013: 108 innings, 12 wins, 1.74 ERA (2.78 FIP)
2014: 170 innings, 8 wins, 5.34 ERA (4.01 FIP)
2015: 113 innings, 7 wins, 3.26 ERA (2.68 FIP)
2016: 139 innings, 8 wins, 4.78 ERA (5.06 FIP)
2017: 7 innings
2018: 87 innings, 7 wins, 2.07 ERA (3.41 FIP)
Buchholz has had some amazing Saberhagenmetrics (via Razzball) throughout the past few seasons, but nobody saw him having the fourth-best ERA in baseball (min. 80 IP) in 2018. Only Jacob deGrom, Chris Sale and Blake Snell can claim a better ERA than the slack-jawed yokel pitching in Phoenix has this season.
We know that Buchholz is now pitching for his third major league team in three seasons. 2018 is really his first full stint in the National League given he made all of two starts last season before missing the rest of the season. In fact, Buchholz began the season in the Kansas City system but was released ahead of an opt-out he had in his contract if he were not added to the major league club by May 1. The fact is, he did not look that great statistically for Kansas City and did not do much better in two starts in Triple-A for Arizona before they called him out of necessity rather than desire.
All he has done since his recall to the majors is post nine quality starts in 14 outings, win half of his starts, and continues to surprise anyone that threw a FAAB dart at him in late May. Buchholz has had a history of health issues, mostly on the extreme side, but this year has been limited to missing a month with a strained oblique. Of course, I rostered him for $1 in May in my NL League where my team name is The Slack-Jawed Yokels, and that is about the only good move I have had all season in that league.
You know the drill by now: are the new results part of any changes in mechanics, approach or process, or simply one of the peaks Lord Zola mentioned?
The BrooksBaseball measurements of horizontal release point (where the pitcher is on the rubber) and vertical release point (arm slot) show nothing different from recent years. Velocity is down, but that is to be expected of a pitcher who has broken down more often than the clunker I drove throughout my undergraduate years at UCF. Even by pitch mixture, we're not seeing much different than previous seasons:
| YEAR | FB% | CT% | CB% | CH% |
| 2012 | 44 | 21 | 17 | 14 |
| 2013 | 49 | 24 | 14 | 11 |
| 2014 | 45 | 25 | 16 | 11 |
| 2015 | 44 | 24 | 15 | 18 |
| 2016 | 41 | 23 | 20 | 15 |
| 2017 | injured | |||
| 2018 | 41 | 24 | 18 | 17 |
A pitcher who sees the success Buchholz has realized in 2018 without changing his repertoire typically points at one of the peaks a pitcher experiences from time to time. That does not mean we should not look at what sherpa has helped that pitcher make this climb up the peak, and something interesting emerges when we look into the run values for Buchholz's familiar pitch repertoire:
| YEAR | FB% | CT% | CB% | CH% |
| 2012 | -9.8 | 4.1 | 1.5 | -1.4 |
| 2013 | 11.5 | 11.9 | 2.2 | 1.4 |
| 2014 | -8.6 | -2.0 | 1.7 | 1.5 |
| 2015 | -4.4 | 6.8 | 1.0 | 6.4 |
| 2016 | -0.1 | 3.7 | -3.0 | -0.5 |
| 2017 | injured | |||
| 2018 | 5.2 | 6.0 | -3.9 | 6.0 |
2018 is the first time since 2013 that Buchholz has had positive run values on at least three of his pitches. The cutter has been a positive pitch for him nearly every season, but it was only 2013, when Buchholz was similarly red hot over a limited time frame, that everything was synchronous as it is now for him.
The cutter is the best pitch for him this year, so we'll begin with it. Cutters are not pitches designed to be swing and miss pitches as much as they are designed to generate weaker contact. Buchholz's cutter this year has a career-high whiff rate of 18 percent, substantially outperforming what he was able to do with the pitch in 2013:
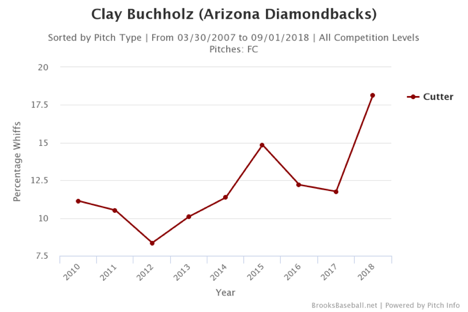
Buchholz gets more whiffs on the cutter this year, but the league hits .233 against it, which is very much in line with previous seasons save that 2013 season when the league hit .160 against his cutter. That cutter, paired with his pedestrian fastball, makes that "heater" look better than it did in 2016. The league hit .246 against the 236 fastballs that Buchholz threw in 2016 and has hit .207 against the 145 he has thrown this season, despite the fact his average fastball velocity dropped from 92.9 in 2016 to 90.9 this season.
Arizona is slightly better than the league average in outs above average, but the 2016 Red Sox were one of the best teams in the league in doing so back in 2016, so we cannot immediately write off this 2018 improvement on the change in defense. In fact, StatCast data states that the expected batting average (xBA) off his Buchholz was one point off his actual batting average against. This season, his .220 opponents' batting average is 42 points lower than his xBA of .262.
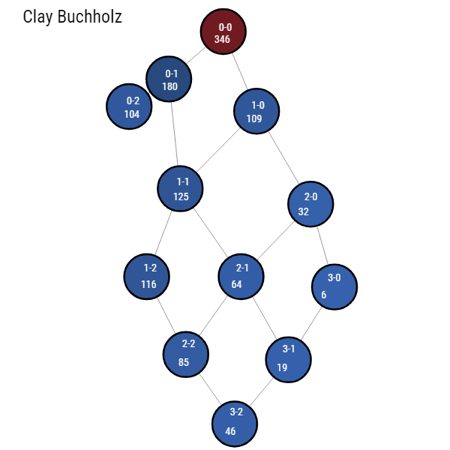
Buchholz, like most pitchers, does better when he is ahead in the count. For his career, there is a 412-point difference in his OPS when the batter is ahead (.919) versus when he is ahead (.507). By batting average, there is a 79-point difference between the .285 when Buchholz is behind and the .206 when he is ahead in the count. Buchholz is throwing first-pitch strikes 68 percent of the time this season, easily his career best in a season where he has pitched at least 75 innings. This is more easily understood with a network chart.
The first chart shows the number of plate appearances Buchholz has had in each pitch count in 2018 over the 346 batters he has faced:
Throwing a first pitch strike is a nice first step, but it is not to most important piece of the puzzle for a pitcher. The more critical pitch for pitchers is what happens with the pitch thrown in a 1-1 count. The league-wide batting average as a whole is .249, but that number fluctuates wildly throughout the different county. The Network Chart Structure below shows the league-wide batting average in each count:
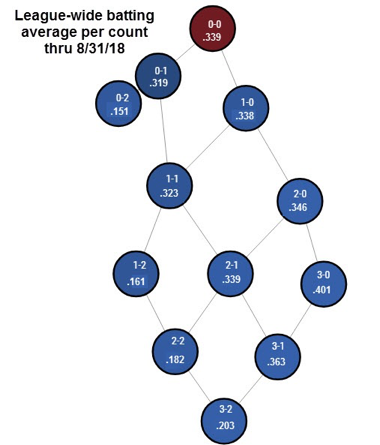
First-pitch strikes are good in theory, but throwing strikes later in counts is more important. The difference in batting average in a 0-1 count versus a 1-0 count is only 19 points, which comes to an extra duck snort or a dying quail here and there. The difference in batting average in 1-2 counts and 2-1 counts is 178 points this season, which 2-2 and 3-1 counts have a slightly further disparity at 181 points.
If we revisit that first Network Chart, Buchholz did a better job of throwing strikes in those 1-1 counts in 2018, doing so 68 percent of the time versus 64 percent this season. The difference this year over previous years has been his ability to bounce back from throwing a ball in those counts. In 2016, Buchholz threw strikes in 70 percent of his 2-1 counts, which put him back on the better path to success in the count. This season, Buchholz has thrown a strike 82 percent of the time in 2-1 counts. Buchholz has reduced his exposure to the bad side of the chart while increasing the number of times he pitches from an inherit statistical advantage:
| SPLIT | 2016 | 2018 |
| Batter Ahead | 33 | 27 |
| Even Count | 34 | 36 |
| Pitcher Ahead | 33 | 36 |
When we look for reasons how a pitcher can surprisingly improve, we find things like this. That said, we are still talking about a pitcher with a number of red flags besides the injury history. At a basic statistical level, we're dealing with a starting pitcher that has stranded an absurd 87 percent of his baserunners on the season, which puts some meat behind the the run and a half difference between his 3.41 FIP and his 2.07 ERA. The .255 BABIP is not out of line with efforts he has previously put up, but it is still 30 points better than his career average. The 50-point split between his .268 wOBA and his .318 xwOBA is yet another one. The tables below show his current company in wOBA and where his xwOBA would have him if he continued to pitch the way he has in 2018. Remember, xwOBA is not a good predictor of future outcomes and only helps frame how good or bad the current performance has been:
| PITCHER | wOBA |
| Corey Kluber | .265 |
| Clay Buchholz | .268 |
| Jack Flaherty | .271 |
| PITCHER | xwOBA |
| Kyle Hendricks | .317 |
| Clay Buchholz | .318 |
| Steven Matz | .319 |
At the end of the day, Buchholz has been a terrific free agent pickup for fantasy owners this season as well as for the Arizona Diamondback as they continue their push to the postseason. That said, the only thing new here is his ability to throw strikes when behind in the count and there are more predictive behaviors pointing to worse times ahead than there are pointing to Buchholz turning some professional corner to a new path of sustainable success.